I have to spend the morning on the gruesome business of trying to make progress in unpicking 20 years of mismanagement of the Reserve Bank pension fund, dating back in some cases almost 30 years. So this morning’s post will be short.
First, the latest update of my quarterly chart of real per capita tradables and non-tradables GDP. Regular readers will recall that this is a rather rough proxy – first developed by the IMF when they were highlighting New Zealand imbalances more than a decade ago. For these purposes, the tradables sector is the primary and manufacturing components of production GDP, plus the exports of services from expenditure GDP. The rest of GDP is treated as non-tradables. Both series are indexed to 100 in the first quarter of 1991, which is when the official quarterly population series begins.
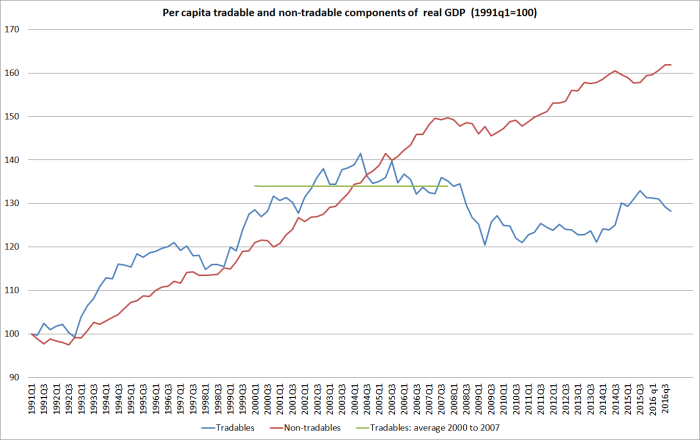
It isn’t a pretty picture. There has been no growth in real per capita tradables sector GDP (on this proxy) for 17 years. The peak in the series was in 2004, and if anything it has been trending down since then. A year or two ago, it looked as though some sort of rebound was underway – all those tourists and foreign students – but even some of that growth has been reversed in the last few quarters. Successful economies – ones that catch up with the leaders, which record strong productivity growth – tend to be those with relatively fast-growing exports, and strongly-performing tradables sectors. A reasonable interpretation of what has gone on is that whatever factors led to the exchange rate being so persistently high – since around 2003/04 – will have accounted for the weak tradables sector performance.
Once upon a time, while I was at Treasury, we had someone do similar charts for a wide range of OECD countries. I’ve only done one for Australia. Here is what it looks like – same definition, based to the same date as the New Zealand one, and on the same scale.
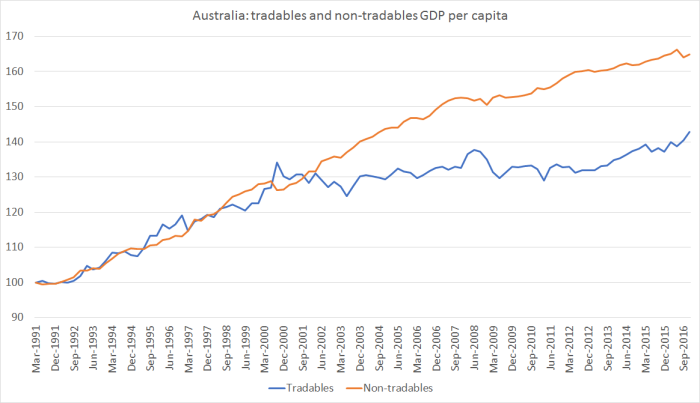
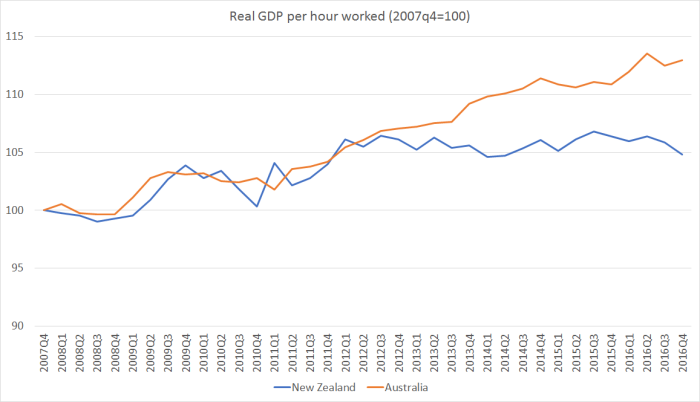
Australia didn’t see much growth in real per capita tradables sector output over the 2000s. In a way, that wasn’t surprising. They had a huge terms of trade boom, which gave them more income to spend, without needing to produce any more tradables to sell abroad. And they also had a massive business investment boom – increasing future production capacity in the minerals sector – which will have squeezed out tradables sector production during the investment phase. But over the last five years, growth in real per capita tradables GDP has resumed again – even growing a bit faster than the non-tradables sector. Perhaps (but only perhaps) there is some connection with the divergent labour productivity performance in the two economies in recent years.
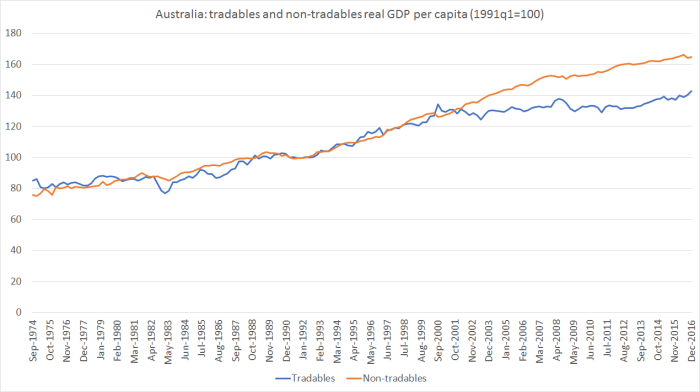
And for anyone wondering if the performance in the 1990s, when tradables and non-tradables production more or less kept pace, was unusual, in Australia (but not in New Zealand) there is the data to do the tradables/non-tradables GDP chart all the way back to the mid 1970s. Here it is.
The sort of pattern we’ve seen – 17 years of no per capita growth in the tradables sector – doesn’t look like the sort of feature one expects in a successful economy, poised to catch up with the rest of world, reversing decades of relative decline. Sadly, of course, New Zealand hasn’t been such an economy. On current policies, there is little reason to expect anything very different in the foreseeable future.

Michael
A couple of questions.
You have used indices of the variables. What are the actual values? I don’t have a good understanding of the relative scale of the sectors or NZ Vs. Australia in dollar terms.
Second question. Is GDP/Capita a good measure of relative prosperity when one country gets a lot of its wealth from what t digs out of the ground and a lot of that value goes to capital providers who may not be Australians?
Tim
LikeLike
Not so sure Australia gets a lot of its “wealth” out of the ground. In the 10 years to 2010 the big 3 foreign mining houses poured $billions of foreign money into establishing new and expanded mines (establishment phase) and it was during that period the Australian economy went gangbusters. The GFC killed off the establishment phase and the extraction phase commenced as the new mining projects came on line. At the same time prices for Iron ore and Coal plunged.
The only benefit the States get is royalties and there are only 2 main mining states and they are Queensland and West Australia. Northern Territory does some extraction and obtains royalties but if you examine the NT State Revenue Office regarding royalties you will find so many exemptions its doubful the receive much in the way of revenue
In 2011 the Federal Government introduced a Mineral Resource Rents Tax from the big 3 BHP, RIO, Xtrata which in the following 3 years produced no tax
LikeLiked by 1 person
Tim
For NZ, the tradables sector on this measure is about 25% of GDP, and for Aus it is about 20%. I think I’ve sent you previously the detailed spreadsheet for this chart, and can happily do so again.
For living standards, GDP per capita is far from idea. That is true in both NZ and Australia – since we both have a large negative net IIP position, so a material chunk of what is produced here accrues to foreigners (in different mixes of debt and equity servicing). fortunately for NZ, with interest rates so low that gap is less than it used to be.
For living standards, one can look at net national income per capita, or – say – actual individual consumption (private consumption and the bits of govt spending consumed directly by households). But both are only available with quite long lags, and typically only annually.
LikeLike
Nonetheless, the biggest gain to Australian consumers was throught the higher exchange rate associated with the strong terms of trade and the investment boom, which will have boosted consumption of foreign tradables and domestic non-tradables, while undermining – while the high exchange rate lasted – profitability and production of the domestic tradables sector.
LikeLike
The puzzle of ‘why’ remains… how we are doing is easy to spot as you note… but why is it this way is a puzzle… there has been quite some growth in ‘value add’ exports such as wine and IT as well as tourism earnings… but it seems to me that the mix of exports/imports in terms of commodities vs value add has worsened over time…
Is there data to dig into relative contributions in terms of the terms of trade between commodity and value add exports/imports? Does that explains some of the underperformance? We are running faster to stand still??
LikeLiked by 1 person
Most of our exports are primary agricultural based exports, dairy, meat, fruit, wine. These are land based products and therefore limited by the land availability. Dairy as an example has already reached its upper limits as it takes 10 million cows to generate only $10 billion in export GDP but the damage to the environment is extensive. 1 cow generates the equivalent waste of 20 people. Therefore 10 million cows is equivalent to having to deal with the eating habits and waste production of 200 million people, therefore, dirty waterways, unswimmable lakes and rivers, contaminated drinking water, leaching nutrients into rivers lead to coastal algae bloom, decimation of coastal fish stocks. Add to that the enormous amounts of methane gas destroys ozone and leads to higher rates of skin cancer, and therefore, higher hospital and medical costs.
LikeLike
And of course climate change and the melting of glaciers, flooding, changed weather patterns, drought etc.
LikeLike
I agree that the “what” is mostly obvious – but even then it is hard to get politicians and opinion leaders to acknowledge the poor performance.
I’m a little uneasy about the “commodity vs value-added” distinction, partly because a lot of productivity gains, R&D etc can often be embedded in the production of commodity-based exports. But as I’ve argued, I think it is true that it has proved more difficult than most expected for non-natural resource based exports to grow very much from here. I suspect some of that is about location – we are just in the “wrong” place for those sorts of products/services (as many other places are) – and partly about the factors that have held the real exch rate so high for so long. In turn, that drives back to factors that have held interest rates up relative to those abroad. And, of course, I argue that rapid population growth in a country with a pretty modest savings rate is a material part of that story.
LikeLiked by 1 person
I heard the “rockstar economy” term used at a briefing this week in Auckland.
It’s a shame that business people in New Zealand tend to refer to glib statements like this as though there is a basis in fact when there is none.
It’s a bit like me deluding myself how fit I am when I haven’t done any proper exercise for 6 months. Comforting to myself in the short term perhaps – not so great for longer term health.
The sooner we shed our collective delusions about our poor performance the better.
LikeLiked by 1 person
The building and construction activity with 72 high rise cranes over the last 12 months was worth $20 billion plus another $20 billion from tourists and international students. No wonder businesses is raking in the dollars. Who cares about productivity per capita when pockets are full of dollars?
LikeLike
No question that we are too far away from the large populated markets. But it does not stop us from providing IT related services or any other services that are available from a computer. With falling oil prices, container ships can certainly reduce the freight costs.
You also need to be mindful that we import a lot of product, which means distance and location is not a factor. These days I can order product from overseas and within 3 to 5 days it arrives at my doorstep.
Plainly and simply we do not manufacture because we cannot manufacture cheap enough to compete globally. Our manufacturers are not competitive. I point to our higher interest rate regime driven mainly by a hawkish RBNZ that have resulted in our persistently high NZD.
LikeLike
Exchange rate must be a factor but so must the negative effects from a regulatory regime that stifles investment. My concern is the 25% in the tradables sector is dominated by heavily indebted companies, with short term strategies dictated by their producer owners.
LikeLiked by 1 person
With tourists and international students injecting $20 billion of new money into the economy every 12 months our economy has devolved into services, accomodation, retail and entertainment. Even the Auckland port which is usually a export hub for our home grown and manufactured products is now considered wasted space and developers are eyeing the potential for hotels and mega retail malls.
LikeLike