This chart has had a bit of coverage in the last few days. It was produced by Statistics New Zealand, and was included in a useful release last week bringing together dwelling consent and population data over the last 50 years or so.
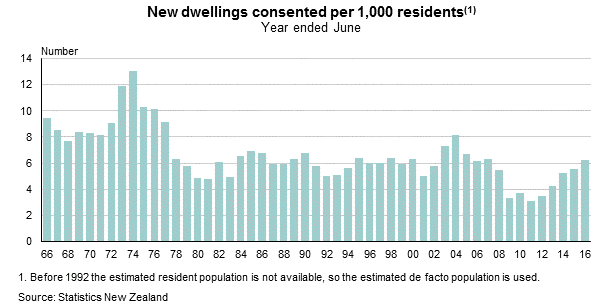
As SNZ noted, there is a bit in the chart for everyone.
The number of new homes consented per capita has doubled over the past five years, but is only half the level seen at the peak of the 1970s building boom, Statistics New Zealand said today.
One sees these sorts of per capita charts from time to time, but I’ve never been sure they were very enlightening. After all, the existing population typically doesn’t need many new houses built – it is already housed, and the modest associated flow of new building permits will result mostly from changes in tastes, changes in occupancy patterns (eg more marriage breakups will probably increase the number of dwellings required for any given total population) or perhaps even the age composition of the population. Even quite big differences in the number of new dwelling permits per capita don’t, in isolation, tell you much: Marlborough and Gisborne have very similar populations, but over the 21 years for which SNZ provides the data, there were almost three times as many houses built in Marlborough as in Gisborne.
Mostly (at least in countries like this one), new houses are needed for increases in the population. Marlborough’s population was growing over that period, and Gisborne’s wasn’t.
So we might be more interested in the growth of the housing stock relative to the growth of the population. Growth in the housing stock is typically more interesting than building permits, because if two old villas are demolished to build six townhouses, it is the net addition to the number of dwellings that is typically more interesting, than the number of new units consented. In recent New Zealand context, if lots of houses are destroyed by an earthquake, the gross number of new consents won’t offer much insight on the supply/demand balance.
SNZ produces some housing stock estimates. I’m not sure quite how they do them, but they suggest that each year typically about 2000 existing dwellings are destroyed, a tiny proportion of the (current) stock of around 1.8 million dwellings. If New Zealand’s overall population was static, there would still be a small amount of replacement activity and – if the Gisborne numbers are roughly indicative – perhaps 11000 new dwelling consents a year for the country as a whole would be fine. Gisborne house prices, for anyone interested, are still lower than they were a decade ago.
Here is the nationwide picture since 1991. This shows the increase in the number of dwellings per increase in the population (thus, 0.4 means one new dwelling added for each additional 2.5 people).
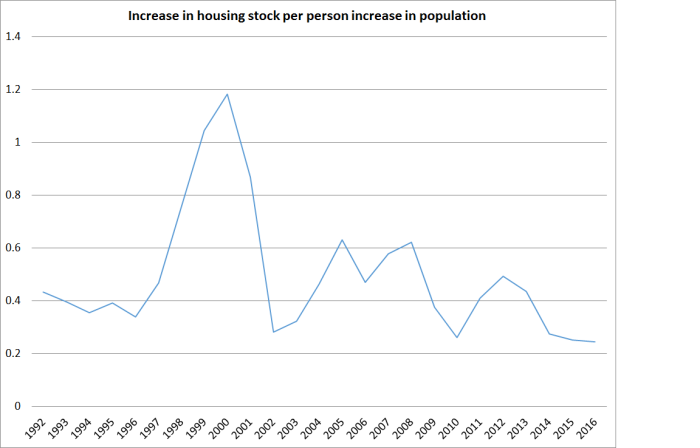
So, far from the situation improving in the last few years – as the SNZ chart above might have suggested (and as SNZ themselves suggested) – things were worse than ever in the year to June 2016. The population is estimated to have increased by 97300, and yet the housing stock is estimated to have increased by only 23800. Talk about dysfunction, and no wonder house prices have been rising strongly. In 1999, 2000 and 2001, by contrast, the population increased by only around 21000 per annum.
SNZ doesn’t have (or not that I can find) annual housing stock estimates back to the 1960s, but we can still look at the new building permit numbers relative to the change in the population. Here is the chart showing new dwelling permits per person increase in the population.
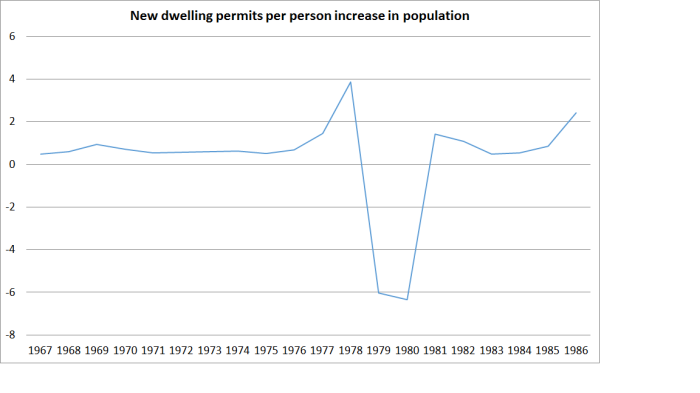 What happened? Well, in the late 1970s the large scale outflow of New Zealanders got underway, and the number of non-citizen immigrants had also been scaled right back. In the years to June 1979 and June 1980, the population is actually estimated to have fallen slightly, and yet 18000 and 15000 new dwelling consents were granted in each of those two years. For the three June years from 1978 to 1980 there was no population growth at all, and yet there were more than 50000 new dwellings consented. No wonder that over the late 1970s and through to around early 1981, New Zealand experienced the largest fall in real house prices (around 40 per cent) in modern history.
Nothing in the data suggests that the New Zealand housing and land supply market is now even remotely capable of coping with population increases of 2 per cent per annum. Of course in some sense it should, and could, be fixed. But there is little or no sign of it happening – are there any reports of peripheral land prices in Auckland collapsing since the Unitary Plan was adopted? – which makes the continued active pursuit of rapid population growth look even more irresponsible (than it would already be, given the absence of evidence of other real economic gains to New Zealanders from such a, now decades-old, strategy)

The rise in older people will tend to disguise dwelling overcrowding because of the increasing number of houses with only one or two occupants. So even in a static population we will need more houses while we work through the baby boomer bubble.
LikeLike
Yes – and the same goes for other phenomena (eg the increased divorce rates a few decades ago increased demand for separate dwelling units for the same population.
In terms of numbers, as I noted, the SNZ estimates suggest about 2000 houses a year are destroyed, but if we take (static population) Gisborne as an example, if NZ’s population was flat perhaps we might need/see 11000 new dwellings a year to meet those underlying demographic/sociological trends. Starting from here – where the number of people per dwelling in Auckland is forced higher by the price of housing – a few more than that would be needed for a while, to undo the existing imbalance.
LikeLike
If one looks at Tauranga, for example, many of that group have moved to retirement villages and rest homes. Our level is about 16% of our population. Its been happening very rapidly in the last two years.
In my day to day work I go into houses where the new occupants are families. One school I know of in the Mount went from close to closing 3 years ago to busting at the seems and in need of new rooms in the space of 3 years. The initial survey showed that there were few children in the catchment and the along came the change. No more houses just a change in occupants from Nana & Gdad to families.
Looking at villages here is an interesting stat. Houses, villa, and rooms have an average occupancy of 7 years before being resold. So with the thousands of “houses” within those complexes there is a huge mobile market. Tauranga is showing some signs of overbuild although there are a lot more on the go.
None of that is measured because they are not sold by Real Estate companies because in general they are Agreements to Occupy and are marketed by the owners of the villages.
The same is true when it comes to permits. No one takes any notice but if you were to research it there are thousands currently being built all round NZ. It’s the new Gold Rush.
LikeLike
Interesting point that the changes of licence to occupy aren’t in the turnover data. But consents to build new retirement villages are included in the new dwelling consent numbers, just as apartment blocks are,
LikeLike
You also need to factor in the 120k international fee paying students and also the overflow of 3.2 million tourists into residential apartments and homes from the lack of hotel building activity.
LikeLike
The biggest delay I have experienced is the RMA which took 2 years to get approval. Building consents took only 3 months. The next biggest delay has been the Public Drainage. It took 3 months to complete and now I have been waiting for final sign off by the Drainage Engineer. This has been a slow 3 months wait and I am still waiting. It is not Council that is creating the delay but private consultant companies that just take their time so that they can keep charging and keep charging you. In NZ we don’t have public servant corruption but we have legal corruption by subbies and contractors that take their time and keep on charging and completing work they should not complete and not completing work they should have completed..
I had a plumber put in 2 down pipes 2 metres apart on the same house when he was supposed to have installed the downpipe on another house. Of course he blames the site manager who blames the plumber.
I had a digger dig 200mm too deep and ended up with a swimming pool on the section which you are not aware of until there is a heavy rain down pour.
I had a builder put in a retaining wall 1 meter too far and he had to rebuild the wall.
I had a painter that just left the windows open and the wind blew out 2 windows and smashed it.
I had a electrician cut large holes into the gyp board for switches requiring the gyp board to be repaired for every switch.
I had one of those temporary plastic toilets that supposedly got damaged that I had to pay to get repaired even though the day before it was perfectly fine. But on pickup was apparently badly damaged. Ask for pics and I get sent pics taken after removal.
3 years for a 3 site subdivision just to get an extra house onto the site where there was a 2 site cross lease and no end in sight as yet.
LikeLike
We were promised by the flat earth free market fanatics in Treasury and the Labour and National parties that the market would deal with these problems. The invisible hand of the market was going to ensure houses were built and infrastructure was going to miraculously appear and we would all be living in a free market paradise.
The market would educate our children, clean up the environment, and make our health service the wonder of the world.
I don’t want to hear excuses. The free market has had 30 years now to work its magic and I want to see results. Where are they?
LikeLike
This isn’t a market failure but a clear example of government regulatory failure: a set of regulatory provisions which mean that the market is no longer able to respond effectively (increasingly supply and not price) to increases in demand (and especially population -driven ones).
LikeLike
This is catch 22. The people who have controlled the regulatory process are the very same free marketeers who have been running the country for 30 years. If the market mechanism was so efficient it would have overcome the government regulatory failure. It hasn’t and it won’t.
On the other hand the socialist intervention by the first Labour government of 1935-1949 solved the housing shortage that had persisted for many years.
LikeLike
Michael is right – every city with a stable median multiple around 3, is that way BECAUSE of the free market and the absence of the distortionary regulations about development, that we have. Take a look online, at Real Estate sites, for Houston, Dallas, San Antonio, Austin, Atlanta, Nashville, Indianapolis, Raleigh, Charlotte (and there are dozens of others). Unaffordability, supply shortages and cyclical volatility are near-global because “save the planet” urban planning is near-global. The other factors that get blamed (globalisation, immigration, credit expansion) are red herrings. They do not cause a problem in the absence of regulatory constraints on conversion of exurban land between uses.
LikeLike
given the banking system prefers land/real estate collateral relative to other forms of security, those in possession of real estate and historical gains can access credit on advantageous terms – further accumulating real estate assets if desired: that isn’t a red herring and contributes to price inflation; supply is likely the dominate driver but, to my mind, how demand is facilitated at high prices matters to the story
LikeLike
QC: most of the “developing” world has a grossly unjust “formal” housing market, which is the reason that illegal slums are so chronic. Mostly “credit” plays minimal role whatsoever in making the median housing unit price in the formal market, typically 12 to 20 times median income. Many people who do buy into the formal housing market, do so with accumulated savings and family assistance. The absence of credit is something that is lamented by many experts looking at third-world underperformance.
But this happens to be a glaring illustration of the housing market problem we are confronting everywhere – supply of land rigged whether by planning or by corruption. There is ultimately little difference. But when credit is absent, there is still a cohort of the population locked out of home ownership, and those who become home owners save for decades (or their parents did) and pay cash, rather than pay off a mortgage for decades. Urban land rent in its monopolistic form will “extract” enforced savings from people just as effectively as it will extract the available credit.
Bertaud has noted that illegal slums in many developing countries are becoming more spacious and better-appointed – and further away from the city – as people gain ownership of motor scooters. This is a clear “informal housing market” proxy for automobile based development as it occurred in the first world. The connection between the reach and flexibility of people’s transport, and urban land rent, is a slam-dunk to prove; it has merely been forgotten by the recent generations of economists and planners.
LikeLike
You have to also factor in the lack of infrastructure spending. Making the developer pay for infrastructure does not equate to cheaper houses. Public drainage costs that I had to pay was $50k so far. The time it took, 3 months to complete and now another 3 months plus for signoff and final inspection. Delays and costly for a developer to have to incur public drainage on behalf of council.
LikeLike
I don’t think the infrastructure costs is a material issue here. Even $50k or $100k on a new house wouldn’t break the bank – if the pre existing land value wasn’t so ridiculously high due to the overwhelming shortage of supply.
Put it bluntly, if you had a choice of $100k in infrastructure charges and $100k blocks of land, there wouldn’t be a problem.
LikeLike
It is ridiculously high when the cost to buy the house was only $25k for a 2nd hand 4 bedroom 130sqm house.
LikeLike
And the land is already serviced by existing drainage infrastructure for 2 existing houses just to relocate 130sqm living space.
LikeLike
Hmm, perhaps more material in this case then.
As an aside, steep infrastructure user charges aren’t necessarily a bad outcome, if they’re efficient and they pass on the right incentives to everyone involved. If it costs a water utility or a road builder a very large sum of money to service a given location, then new builders should only be putting new houses there if they can fund those higher charges. (Maybe the view there is really amazing and the cost is worth it.)
Alternatively, if there’s a cheap location to service with a low marginal cost of development for that basket of infrastructure requirements, then new builders should be incentivised to build there. It seems a lot of people think that a lack of infrastructure is a serious impediment to development – but in reality lots of utilities have very mature and well thought out charging frameworks to do this with little or no fuss. The major problem is usually the services which aren’t covered by those charges causes the problem (like roads, schools, or hospitals), and governments try to restrict the expansions of suburbs to control their own costs which aren’t recovered.
Incidentally – the fact that there are mature infrastructure cost recovery mechanisms out there also undermines one of the primary reasons for zoning as well. With full cost recovery in infrastructure, you don’t need a planner telling you where you should or should not build: the price to service the blocks helps communicate that very clearly.
LikeLike
Ryan; good urban economics text books state something like the following.
The trend in supply-constrained markets, is for “fees” to be a “share of planning gain”. Developers who know what they are doing, who are trying to compete for both sites and for sales of finished housing, have to take into account the fee costs in between the two. The vendors of the land or the sites might get $600,000 per acre instead of $1,000,000. The price of the finished housing will be the same whether there are fees or not. Abolition of fees results in site owners getting higher prices. In fact site owners capture everything – higher permitted densities, reduced standards, public investment in local infrastructure and amenity, reduced interest rates; subsidies to home buyers; whatever.
But in non-supply-constrained markets like the US median-multiple-3 cities, the land price is largely anchored in rural exurban values within functional transport distance of the market. Developers buy land pretty much like producers buy any resource in a competitive free market with superabundant supply quantities. Then any fees are a simple “cost on top”. Housing remains systemically affordable because the fees are seldom high enough to drive the median multiple up much. Unlike land supply constraints.
LikeLike
I think you’ve missed the point here Ransome (to put it politely). Free market fanatics don’t go putting constraints on dwelling supply (like urban growth boundaries, maximum heights, plot ratio limits, or kafkaesque planning consent processes). They’re usually the ones that go pulling them down and screaming for more removal of rules.
There’s no catch 22: it’s a clear example where a well intentioned policy maker has made a series of terrible mistakes, and shows no sign of admitting their fault (or responsibility) in the process. There are perhaps other instances where you can complain about free market radicals, but this isn’t one of them.
I mean, the supply of bread is pretty close to a free marketeers wet dream – but I don’t see you running out of bread.
LikeLike
I didn’t claim the free market doesn’t work at all. Its a matter of extremes. The free market is great at supplying readily available cheap fast food but rubbish at providing public health services. And somewhere in that mix is housing.
Has 30 years of the free market ensured the most vulnerable of our people are properly housed, fed and educated with access to sound health services? No and in fact they are worse off.
We need to stop following ideologies and start solving problems.
LikeLike
The market works really well in providing reasonable and affordable housing (range of options etc) if it is allowed to work, which mostly it hasn’t been. Price to income ratios seem to have fluctuated around 3 for decades, before the urban planners got hold of the process (not just here, but in the UK, Australia, Canada, and many bits of the US). Many prospering areas of the US still today allow the market to work, and their people benefit from price to income ratios down around 3. So, in that sense I totally agree with you: we need to stop following (planners’) ideologies and let the market work. It won’t be perfect – nothing human is – but it will be a great deal better than what we have now.
LikeLike
Michael – there is another factor, and that is “rate of replacement of housing stock”.
I understand OECD average turnover of housing stock is around 70 years. Japan is an outlier on the low side, at half this (they love new things and hate used things – it is cultural). John Stewart (2002) estimated that the Planning system in the UK had introduced such dysfunction and undersupply, that new homes being built then might not be replaced for 1000 years +
We are trending the same way, as is every other nation being sucked in by urban planning utopianisms.
LikeLike
Yes – that replacement activity is captured in the 2000 houses a year I mentioned (the difference between the number of new dwelling consents and the change in the housing stock). From memory, SNZ assumes either a 50 or 70 year economic life of a house, which would imply a much larger rate of replacement than is consistent with the 2000. But, of course, a lot of houses are substantially rebuilt over time – extended, reclad, rewired, replumbed etc – without ever requiring a consent as a “new dwelling”.
I looked at the main street of Island Bay, which probably has 200 houses and the originals would all have been built at least 90 years ago. In the 40 years I’ve lived here, probably not more than 10 or 12 will be have been replaced.
LikeLiked by 1 person
Ha, more than 90 Micheal.
Have a look here; Great site and lots and lots of old photo’s of Wellington region.
Some amazing photo’s form way back
LikeLike
I did say “at least” 90 years old, and some years ago looked at a house on that street built in 1926. Thanks for the photo.
LikeLike
Michael the consent per capita figure is useful for comparing the supply responsiveness of different urban areas to various demand factors.
Greater Christchurch so including Waimak and Selwyn hit a build rate in excess of 12 per 1000 after the earthquakes while Auckland is down at 6, under the national average despite being the recipient of an immigration boom.
Maybe you could present those graphs Michael? Maybe this would explain why rents and house prices are stable or declining in Canterbury and are increasing strongly in Auckland?
LikeLike
Brendon
I’m still skeptical that consents per capita is the right metric. In the context of your specific example, consents (or, better, change in housing stock) per increase in the population seems more appropriate. Canterbury has had very little population growth in the last half dozen years, and Auckland has had lots. But…which is why change in housing stock really matters…Canterbury also lost lots of houses
LikeLike
Michael -Canterbury is the second fastest growing region and second largest region in the country -so it surely is the most comparable urban region to Auckland?
But the comparability is even more significant than that, the two regions have both experienced a recent demand shock -one because of the rebuild following the earthquakes and the other because of high immigration rates -your area of interest. Yet Christchurch managed to somehow? build at twice the rate of Auckland on a per capita basis. Shouldn’t this be something we investigate further?
LikeLike
I agree it is worth further investigation, but bear in mind that a fair number of the Canterbury permits were to replace houses on land that was already part of long-established residential areas (isn’t a land use change – and land use restrictions are typically more of a problem that straight building ones). Generally, that will involve quite different sorts of issues than those associated with rapid population growth. I fully accept the story that the Selwyn council is pretty growth oriented, and the recent Press story on Rolleston is very encouraging (although I remain a bit skeptical about the attractiveness of Rolleston 20 years hence), and also that the Akld story is pretty dire. My only point is that permits per capita don’t really shed that much light on things. Perhaps they do in two cities in which population growth is roughly the same – perhaps Tauranga and Akld? – but not in a straight greater Chch vs greater Akld comparison, where not only are the population growth rates wildly different but Chch lost a large existing stock of houses as well).
LikeLiked by 1 person
Michael you are making suppositions which appear reasonable -but I am not sure are supported by the facts. It is my understanding that Canterbury’s population growth this century is stronger than Bay of Plenty’s for instance. Despite the constant self promotion of the wider Auckland -golden triangle -Auckland/Hamilton/Tauranga crowd. Maybe you need to put up some population growth charts. For instance many people of your generation are unaware that the drift north from the South Island has stop and reversed some years ago.
Secondly, if you break the building consent per 1000 figures down to municipal districts you will see the rural districts of Selwyn and Waimak immediately post earthquakes responded but CCC took 2 years to get going -so the existing consented urban land use theory is also suspect.
Really Michael we are arguing about two sides of the same coin. We either investigate how we can build more houses on a per capita basis that are more affordable in response to demand pressures or we investigate how we can reduce demand by for instance slowing down immigration. The solution is probably a bit of both.
LikeLike
Brendon, Auckland has some uniques features
1. plenty of land out at the Waitakere Ranges. All we need to do is chop down a few hundred Kauri forests.
2. 57 sacred volcano mounts around central and regional Auckland subject to viewshaft(visual) height limits ie you need to be able to view the top of each volcano mount from eye level from each public park to the top of each mount.
3. streams and rivers, and peaks and valleys, you need bridges and tunnels. The longer the road or rail track, the more tunnels and the more bridges you need to build
4. Auckland is already stretched 129km from Leigh up north to Pukekohe south. Houston with 6.2 million people is stretched only 118km from the Woodlands north to Texas City South.
Essentially we have put our largest city on the smallest stretch of dirt in New Zealand.
LikeLike
Len Brown is spending $2 billion for intercity rail to get us from the Harbour which is super dense to get us to Mt Eden which does not even have a shopping mall. There is nothing there in Mt Eden for the spend up for our mass transportation intercity rail. Zero bang for $2 billion of ratepayers dollars. Therefore the only sensible logic is to have rezoned Mt Eden and Mt Roskill 18 to 50 level buildings under the Unitary Plan. They did not and will not when the Unitary Plan is final. That is the failure of the Unitary Plan, the failure of the Independent Hearings Committee and the failure of Council.
LikeLike
The Aucklanders stretched from Leigh to Pukekohe, are surrounded by OODLES of raw greenfields land, for which the only reason it cannot be developed, is the dam urban planners.
Auckland managed to be affordable back when whole suburbs like Mangere were being built, and at that time the city was far more confined withing the Isthmus. Now it has burst out of the isthmus, there is far MORE directions in which the “fringes” can push out, than there ever were before.
“Shortage of land” is a BS argument. If it were true, why are the planners so desperate to “contain urban sprawl” with a deliberate boundary and rationing of exurban growth nodes? If the geographic difficulties made land-price-reducing sprawl impossible, the boundary policy would be a nonsense. But no-one is criticising the boundary policy on any basis other than that it is stopping oodles of land from being brought into price-reducing supply.
LikeLike
Brendon
I’m strongly in favour of improving supply responsiveness, and am quite evangelical about the point that whatever immigration policy, there is no need for price to income ratios to trend up if the regulatory obstacles were removed.
So if we are disagreeing it all, it is only about whether consents per capita is meaningful indicator of responsiveness. I don’t think they typically are, and favour ones which compares flows with flows (new houses and new people) rather than flows with stocks (which is what the per capita numbers do).
On population, SNZ only has the subnational numbers to 2015. But for the 5 years from just before the quakes to 2015, Akld’s population rose 9.0%, Hamilton’s 9.4 %, Tauranga’s 8%, and greater Chch (city plus Selwyn plus Waimak) 2.6%. On that basis, if Chch had had exactly the same responsiveness as the northern cities – and all else was equal – it would have had many fewer consents per capita than the northern cities. But add in the earthquakes and the substantial loss of the physical housing stock – in my family alone, my parents and sister both lost their entire house – it just further muddies the water. Changes in housing stock get around that, but i’m not aware that SNZ publishes those at a TLA level.
Measuring relative responsiveness of consent really ideally needs a proper, well-specified, empirical model. Population changes and loss of existing stock will be the most important variables, but so will other demographic factors.
As for “my generation”….I have been pointing out for some time that there has been a net flow of NZers out of Akld for last 20 years, but much of that seems to be to Hamilton and Tauranga. Absent the quake, Chch probably would be doing well (and as a Canterbury lad nothing would give me greater pleasure), as is Queenstown, and Nelson lags a bit behind, but the overall South Island story, like the overall North Island one – see Gisborne or P North – is pretty patchy, and there is an awfully large number of foreign migrants who do come to Akld
LikeLiked by 1 person
Of course foreign migrants include the 120k foreign fee paying students, 5k long stay tourists and 30k unemployed kiwis chucked out of Australia and 30k foreign workers for Christchurch rebuild.
LikeLike
Michael doesn’t your flow rate assume that the main driver for building more new homes is population growth. But that may not be the whole truth. The flow might also be in response to disaster not just earthquakes. Sea level rises might be a driver in the future in places like South Dunedin. What about income level rises be a driver for demand for more residential space. What about social change leading to changes in household sizes? Leading to more supply of particular sizes homes.
Would not a regional per capita build rate be a useful measure to help track these alternative demand shocks?
LikeLike
I guess my key points were:
– to really get a measure of responsiveness you need a model that encapsulates all main sources of new demand, including the idiosyncratic ones (fortunately, doing this within a country, as distinct from cross-country, some things affect all places equally (eg taxes, interest rates, credit conditions (at least absent LVR controls), inflation and broad overall economic conditions)
– comparing flows and flows is less unrepresentative than comparing flows (consents) with stocks (total population)
All sorts of other factors are clearly relevant – otherwise there wouldn’t be 100 new houses a year built in Gisborne, a city with no population growth.
LikeLike
On population, SNZ only has the subnational numbers to 2015. But for the 5 years from just before the quakes to 2015, Akld’s population rose 9.0%, Hamilton’s 9.4 %, Tauranga’s 8%,
Yes and during that time house prices and sales in Tauranga were not that great nor was rent. There was definitely no shortage of sections and sections could be had for as little as $150k unlike now when 300k is becoming the norm.
Its conjecture on my part but I would suggest that Aucklands population was driven by students and as it is still.
LikeLike
If you build more houses based on per capita then you finish up with a dearth of empty houses like we did in 80 and 93-4. Who needs that. We need to build to reflect losses and increased population.
all rather logical.
LikeLike
Hmmmm…. no discussion of the secondary market at all!!! The level of sales is running about ⅔ of what it was before the GFC… which is either a demographic shift in terms of the population ageing or fewer NZers emigrating and selling up… or something else…
If the listings data is telling you that regions all over NZ have historically low levels of houses available for sale then that is important data… but nothing?!??
LikeLike
all no doubt important issues, but not really ones for this post – which was really just about whether consents per capita or consents per change in population was relatively more meaningful.
Personally, I’ve interpreted the low turnover per capita numbers as a sign that, nationwide, this isn’t some over-exuberant frenzied boom, just a market driven inexorably higher by the interlocking pressures of population growth and land use restrictions.
LikeLike
Michael
I share your concern over the use of consenting rates., You wouldn’t gain anything at all by comparing the consenting rates of Wellington City and, say, Hamilton City. Two reasons: (1) population growth in Wellington is fairly languid and (2) it is not clear in which direction causation runs.When I broke out Christchurch City, Waimakariri and Selwyn I could tell myself a story that the two peri-urban districts were venting Christchurch because it was so slow to develop new housing. But you could just as easily tell the story that people preferred the bucolic lifestyle and, therefore demand was lower in Christchurch.
It got more interesting when I plotted consenting rates against estimated population growth. You more or less lose the time sequence but you get a better feel for which councils cope with changes in growth rates. Prior to the earthquakes the data suggests that Christchurch was hardly covering itself in glory but between the three councils at least the Greater Christchurch area has always been on the right side of the line. On the other hand Auckland has consistently under-supplied (if you are targeting an occupancy rate of about 2.5 people per dwelling).
But it is way more illuminating than the usual Nick Smith drivel of “we have built more houses this year than any year since..” (cherry pick your own start date here).
LikeLike
Thanks Donald
Entirely agree with your last paragraph!
LikeLike
We can see from house prices what is happening in Akld. But it sounds like the discussion has highlighted that there would be a good case for SNZ to significantly revamp their data collection/analysis on the combination of population flows, housing demand (whether from population flows, divorces, etc.), housing supply (incl right to occupy) etc.
Because housing supply isn’t always a free market, being able to demonstrate the failures/successes in various markets eg. Akld (failure), Selwyn (successful I believe) by numbers from SNZ would, I think, be useful.
LikeLike