Pottering around the web, and working my way through my emails, on my return from holiday, I found a couple of things from The Treasury that caught my eye.
The first was the release of new risk-free rates and CPI inflation assumptions – inputs that are required to be used in preparing the government financial statements. Treasury releases these every few months. They don’t get much attention – presumably outside government agency accounting departments – but out of curiosity I opened the latest one. And as I dug into the history of these assumptions what I found was really quite startling.
When I was at the Reserve Bank we often used to bemoan the fact that Treasury’s published inflation forecasts never seemed to settle anywhere near the midpoint of the target range. In fact, for a long time the Treasury approach seemed quite reasonable – after all, in the first 15 years or so of inflation targeting, the average annual inflation outcomes had been around 0.5 percentage points higher than the (successively revised) target midpoints. Reasonable people can debate why that happened, but it did. It was unusual – in most inflation-targeting countries, out-turns had averaged nearer the midpoint of the respective targets – but as the midpoint wasn’t mentioned in the PTA it wasn’t a major accountability issue. Don Brash took the midpoint quite seriously, while Alan Bollard wasn’t too bothered by it, but under both Governors inflation had averaged higher than the midpoint.
The Treasury’s continued assumption/forecast that inflation would settle back to around 2.5 per cent had become more frustrating, and questionable, in the years since the 2008/09 recession. Actual inflation outcomes had begun to persistently undershoot the midpoint of the target, and the midpoint of the target range had been explicitly added to the Policy Targets Agreement in 2012. The Bank, the Treasury, and the Minister of Finance all agreed that the focus of monetary policy should be the midpoint.
These are the assumptions Treasury published two year ago.
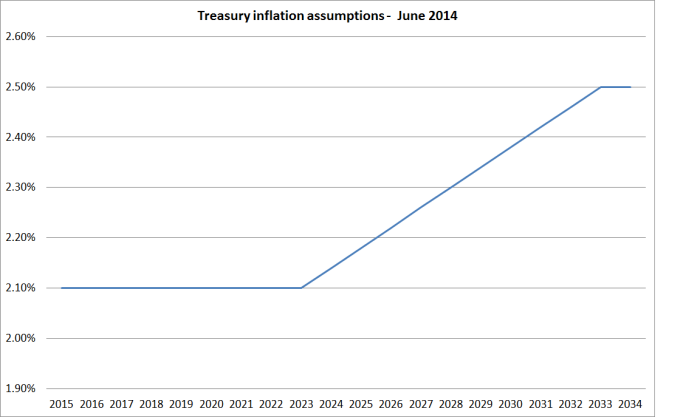
At the time, it seemed like the ultimate in very slowly adapting, backward-looking, expectations. By this time last year, they had markedly revised down their assumptions for the next few years (it wasn’t until 2030 that they assumed that inflation got back above even 1.75 per cent), but still assumed that in the very long-term inflation would eventually revert to 2.5 per cent. If the Reserve Bank was, as it said, concerned to see long-term expectations centre on 2 per cent, there was still some (rather limited) cover in the Treasury assumptions for a moderately “hawkish” stance. “Not even Treasury yet takes the 2 per cent midpoint that seriously” they might have argued.
But not any more. Here are latest CPI inflation assumptions from The Treasury.
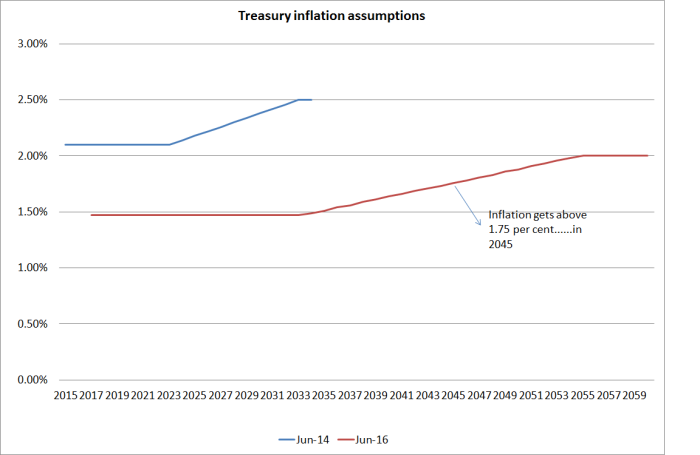
They have had to dramatically extend the horizon they provide numbers for to encompass the eventual return to their long-run assumptions. But it is 30 years from now before they assume inflation gets back even to 1.75 per cent, and almost 40 years to get back to 2 per cent.
I’m not sure quite what is going on here. On the one hand, Treasury is the chief adviser to the Minister of Finance, who has signed a Policy Targets Agreement with the Governor of the Reserve Bank requiring him to focus on a 2 per cent midpoint. And on the other hand, it is pretty much common ground that monetary policy works with a lag of perhaps a couple of years. Anything beyond, say, 2018 is definitely an outcome monetary policy can control. The PTA needs to be renegotiated next year, but not long ago the Secretary to the Treasury was quoted saying that he didn’t think Treasury would be suggesting major PTA changes. And yet Treasury thinks the best guess for inflation for the next 25 to 30 years is something well below the target they and the Minister are asking the Reserve Bank to achieve.
Of course, with yet another surprisingly weak CPI outcome just released, building on years of undershooting the target, Treasury might yet be right (between Reserve Bank policy (mis)judgements and the global deflationary environment). But whether they are or not, what should disconcert the Governor – and the Board, and those monitoring the Bank, such as Parliament’s Finance and Expenditure Committee – is that not even Treasury believes him any longer. They might say otherwise in their official advice – which we haven’t seen – but these are the numbers they consciously chose to publish.
And, of course, it is not as if Treasury is alone in its doubts. For all that the Reserve Bank likes to quote surveys of a handful of local bank economists, the market has its own approximate “price” for implied future inflation. This chart takes the 10 year nominal government bond yield, and subtracts the yields on inflation-indexed bonds. It isn’t a precise measure for various reasons, including the changing maturity dates on the various bonds, but the picture is pretty clear and persistent.
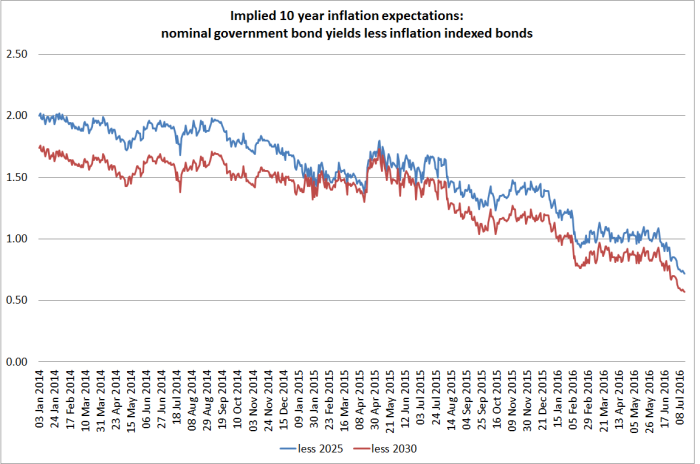
As late as two years ago, the implied inflation expectations for the next 10 years were very close to 2 per cent. Now they are around 0.65 per cent.
A persistently easier stance of monetary policy is much overdue. Not even Treasury seems to take the 2 per cent midpoint very seriously now.
(UPDATE: Someone at Treasury pointed me to their relatively recent – and useful – methodology note, which explains the relatively mechanical approach they currently take to updating the CPI inflation asumptions. I don’t think it really changes my story, since the considered judgement has gone into the decision as to how best to represent a reasonable future path for inflation. The Treasury has consciously chosen to put a considerable weight on indexed bond pricing, while the Reserve Bank excludes that information completely from the inflation expectations curve it regularly cites in its updates.)
On another matter, I have lauded the Treasury’s approach to the Official Information Act issues. They seem to take seriously their obligation under the Act, and although they receive a lot of requests (about 350 in the last year) have not sought to charge anyone. They withhold material from time to time, but I’ve had enough confidence that they were playing by the rules that I have never sought to challenge those decisions, asking the Ombudsman for a review. That changed this morning.
A while ago I asked for
Copies of any material prepared by The Treasury this year on regional economic performance, particularly in New Zealand. I am particularly interested in any analysis or advice – whether supplied to the Minister or his office, or for use internally – on the economic performance of Auckland relative to the rest of the country (whether cyclically or structurally).
I wasn’t expecting much; perhaps some anodyne comments on some or other aspect of recent data, including perhaps the regional GDP data released in March. But while I was away, I got this reply
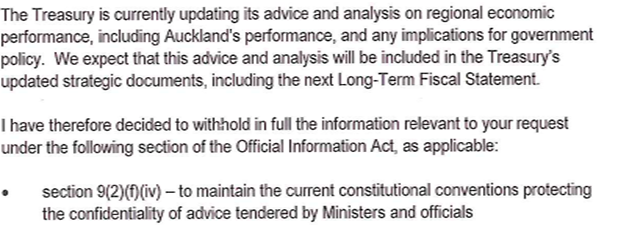
It is all very well and good for Treasury to be updating its analysis and advice. But I asked for what they have already provided, not what they might (or might not) include in future “strategic documents”, such as the next Long-Term Fiscal Statement, which does not have to be published until July next year.
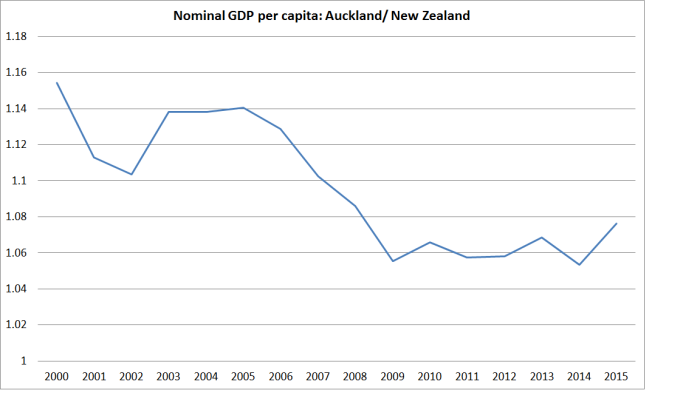
Given that they are not even willing to publish the titles or dates of any documents (whether internal or provided to the Minister) it does raise the question as to what Treasury has to hide. Given the woeful underperformance of Auckland – considered in per capita GDP terms – perhaps Treasury is finally awakening to the fact that something is wrong with the Think Big Auckland strategy? That might be awkward for the government, but isn’t a good basis – under the OIA – for withholding material, especially in such a blanket way.
As a reminder, here is how badly Auckland has done
Over time
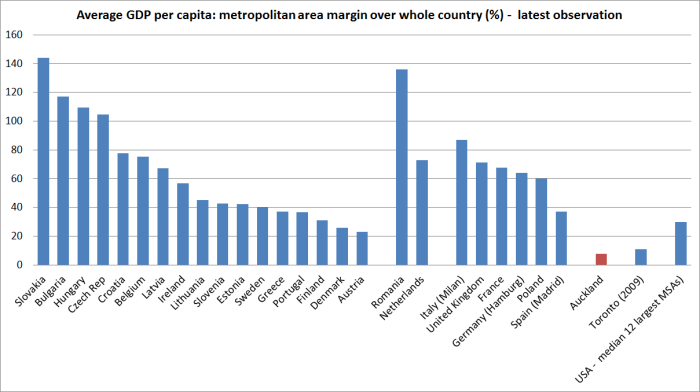
And in comparison to the largest cities in other advanced countries
I’m not sure what Treasury is hiding, or why. Perhaps the Secretary is reacting defensively to my criticisms of his recent speech? But it was that speech that prompted my original request, to see what analysis lay behind his upbeat claims about Auckland.
As an organization Treasury is better than the standard being displayed here: we see the good side of Treasury again in the recent pro-active release of Budget background papers. It is time for them to reconsider, and to release any analysis or advice they have prepared on the Auckland’s economic performance. I’ve asked the Ombudsman to review the decision.

Interest.co.nz gave a lot of coverage last week to stories about the RBNZ and Treasury questioning the government’s immigration strategy. I did not see these stories get picked up by TVNZ, Stuff etc. (Not sure why?). But perhaps if the bureaucrats are readjusting their internal views to be at odds with the government, they would be in a pretty awkward position.
LikeLike
Given the introduction of hedonics into such statistics, they have become less reliable and less credible as a means of knowing what the true inflation rates are, as experienced by a NZ household.
LikeLike
Mike, well done on going to the Ombudsman for review. That OIA decision is close to outrageous
LikeLike
Given the introduction of hedonics into most such statistics, they do seem to have become less reliable and less credible as a means of knowing what the true inflation rates are, as experienced by a NZ household.
LikeLike
I’m a pretty simple guy so excuse a question I feel like I should be ashamed to ask.
We want inflation, right? Especially without all the low interest rate induced asset bubbles?
Then instead of traditional QE (kinda sad there is a traditional form of it now) why can’t central banks create money and simply deposit those funds every fortnight (or month, whatever) for a specified period of time (say a minimum of 12 to 18 months) to get people spending again on small everyday items, like the kind that comprise the basket in the CPI calculation.
That low interest rates result in higher inflation doesn’t seem to hold water these days. Not saying that it hasn’t, or won’t in the future. Lower interest rates should increase disposable income which should get spent. But it doesn’t for some reason. Bonds bought back from reserve banks should increase liquidity massively at the banks (it does) which they should lend out to companies, creating jobs and demand and ra ra ra. But that doesn’t seem to work. It just creates is massively liquidity sloshing around international asset markets pumping up every asset price on earth.
So lets just put some money in everyones account every fortnight, spare change, that will get spent in the real economy.
Why is that so stupid? Why does no one discuss this??????
Thanks,
Curious Wonderer
LikeLike
What you are talking about has indeed been discussed – although not implemented (yet) – in countries where the scope for conventional monetary policy has been exhausted (interest rates at or below zero). It might well happen if there were to be a serious new recession in one of those countries. In NZ – and Australia – we just don’t have the same need. Inflation still seems responsive to interest rates (it is just that our real interest rates are no lower than they were for several years prior to the ill-fated and ill-judged tightening cycle in 2014), but the RB has been reluctant to use the leeway it has. Some might be skeptical that lower interest rates will, all else equal, raise inflation, but I think we can even see some signs of it over the last year, where markedly lower OCRs have been associated with a stabilization, and perhaps even a slight rise, in inflation. It is just that it hasn’t been enough. Cut the OCr to say 1.5%, and sound as if you are serious about it, and I’m pretty confident that over the following couple of years we’ll get inflation a lot closer to the target midpoint.
LikeLike
Right, understand all that. But – to the point of my question – sure lets continue to lower interest rates so as to actually budge the real interest rate down, and surely some inflation will come up. But that won’t be anything compared to the asset bubbles that foam up in the residential and commercial property sectors and to a lesser extent the local sharemarket. That is highly undesirable and I do believe something you sorta brush off as noise.
Wouldn’t it be better to use QE directed towards individuals rather thank banks to create more inflation and keep interest rates from going too low, avoiding asset bubbles?
LikeLike
I’m not sure your approach would really make that much difference. After all, with more cash in their pockets households will be ready to purchase more stuff, including more houses (cash and credit). It wouldn’t be exactly the same, but similar enough.
Re interest rates and housing, just recall that they can’t be the dominant story – Wanganui and Gisborne have the same interest rates as the rest of the country, and very different house price outcomes. The biggest issue – not the only one – is unexpected population growth coinciding with land use restrictions. recall too that we still have the highest real interest rates in the advanced world.
LikeLike
actually I’d simply suggest it is the perception of interest rates that matters at the moment, and the same with immigration. perception of all this has overshot actual fundamental value by a long way.
I can point to you several states in the United States where interest rates are lower and they are experiencing higher inbound immigration, and some with reasonably tight planning. Colorado for instance. yet their house prices increases pale in comparison to New Zealand.
its an investor driven frenzy driven by perceptions of key fundamental drivers more than anything else, and it has way overshot the mark.
LikeLike
you might be right, altho when I looked at the Demographia numbers Denver price to income ratios were higher than any of those for major US cities where geography itself wasn’t a major constraints (eg places on bays, islands etc, isthmuses etc). so a great deal cheaper than akld, but the price to income ratios are similar to those of most other nZ cities – ie still too high
LikeLike
When the Christchurch Earthquake hit and the government clearly needed to borrow $20 billion to fund the rebuild, the US was in the middle of the trillion dollar QE program. I thought that would have been an ideal time to have printed of $50 billion NZD. No one would have noticed and the NZD would be at a lower rate and Christchurch would have been fully funded and everyone happily paid out..
LikeLike
Interesting response from Treasury.
One is left wondering if now that critical analytic advice is being seen more “the Brass” in government is becoming sensitive to that information resulting in a shut down of release of that information.
As I understand the OIA it was about giving power to the people and ensuring that Government and it’s various responsible entities would not or rather could not shut that information away.
Seems that the Nats. are not an open Govt. at all. Treating us like they own the place.
LikeLike
The graph on Auckland nominal GDP per capita falling is interesting. Fell under Labour, flat under National. An overlay of net population growth might assist understanding why. Also, if the series is converted into “real” then would be close to zero or negative? How can we lift performance in this “rockstar” economy? It all seems to be smoke and mirrors at present with not much trickling down to the neediest.
LikeLike
I don’t think the net population growth will explain that much about the differences – there was a huge population surge around 2002/03 (larger as % of popn than the current one) and another in recent years. Impressionistically, Auckland tends to do worst cyclically when immigration turns negative (so economic downturns hit Akld harder). There is variability in the series, but I’d tend to emphasis the trend – in particular, that it is not upwards, as the Think Big people should have expected.
Of course, if you converted to reals, you would have to do it with both numerators and denominators. It probably wouldn’t change the picture too much – but we don’t have the data to know with any confidence.
LikeLike