Last year, in the course of the Reserve Bank’s faux consultations on its proposed investor finance LVR restrictions, I devoted several posts to the results of the Reserve Bank’s stress-testing exercise. Those tests – 2014 ones – appeared to show that, even if faced with a very severe adverse shock to (in particular) house prices and unemployment, the New Zealand banking and financial system would come through substantially unscathed. “Substantially unscathed” here meant some significant loan losses, not typically enough to wipe out even a full year’s profit, and a decline in capital ratios – the latter simply because in the models as house prices fell the assigned risk weight on each still-performing loan would rise (eg a loan that might have had a 60 per cent LVR at origination becomes a 90 per cent LVR loan if house prices fall by a third). But there was nothing that suggested a threat to the soundness of any of the banks, or the banking system as a whole. That result should not have been too surprising. Bank shareholders have considerable amounts of their own money at stake and credit allocation in New Zealand is not distorted by large scale government interventions (unlike pre-crisis US, or Ireland). Housing loan books typically don’t see huge losses even in really severe crises – and there hasn’t been a mad rush of highly risky corporate or property development lending in recent years. But if the banks came through such tough stress tests in relatively good shape, what possible basis could there be for yet more rounds of direct regulatory controls, which inevitably impair to some extent the efficiency of the financial system?
The Reserve Bank was never really satisfactorily able to respond to this point, even when some media and MPs started asking the questions. The Governor went ahead and regulated anyway.
And now he seems to want to do so again.
This year, the Reserve Bank has been back with some more stress test results. I wrote about their 2014 dairy stress test results here. That scenario, and the results, didn’t look sufficiently severe, and there are already signs of worse outcomes than those indicated by the stress tests.
And then in last month’s FSR, we had the results of another set of stress tests on banks’ entire loan portfolios.
In late 2015, the four largest banks in New Zealand participated in a common scenario ICAAP test. This test was a hybrid between an internal test (conducted regularly with each institution choosing their own scenarios) and a regulator-led stress test (occurring every 2-3 years with common scenarios and assumptions). Due to the use of a common scenario across banks, the results of the test provided insights for the financial system as a whole. However, the test featured less standardisation of methodology than a full regulator-led exercise. For example, there was no ‘phase 2’ where loss rates were standardised.
Like the 2014 regulator-led stress tests, the scenario used in this exercise was severe
As with previous regulator-led tests, the stress scenario was a severe macroeconomic downturn. Over a three-year period, real GDP fell by 6 percent, unemployment rose to 13 percent, and dairy incomes remained at low levels. Residential property prices fell by 40 percent (with a more severe fall of 55 percent assumed for Auckland); and both commercial and rural property values fell by 40 percent. Finally, the 90-day interest rate fell by about 3 percentage points due to monetary policy easing,
These are very demanding scenarios. In particular, for the unemployment rate to rise to 13 per cent, it would have to increase by more than 7 percentage points from the current quite-elevated level. Even in the severe recession in the early 1990s, associated both with a financial crisis, disinflation and considerable fiscal consolidation, and a period of substantial structural change, New Zealand’s unemployment rate did not get above about 11 per cent. No other floating exchange rate country has experienced an increase in its unemployment rate of that magnitude in modern times – not even, for example, the US following 2007.
To be clear, I’m not objecting to the scenario. Stress tests are really only useful if they use quite severe scenarios – anyone can pass easy tests – but this scenario looks to have quite a few buffers built in. Similarly, a 55 per cent fall in Auckland house prices would be one of the larger falls ever seen anywhere – again, not totally implausible, especially as New Zealand is prone to population shocks – but about as large as the biggest falls ever experienced in an advanced country major city. On the other hand, the last sentence of that scenario is worth noting: the ability to cut policy interest rates provides a substantial buffer (to economies and banking systems) in difficult times. But with the OCR at 2.25 per cent, it would now be quite a stretch – to the outer limits of conventional monetary policy – for the 90 day bill rate to fall by three percentage points. The Bank may need to take explicit account of that limitation in future stress tests.
In this stress test, the overall losses were quite substantial
The cumulative hit to profits averaged around 4 percent of initial assets (figure C1), which is a similar outcome to phase 2 of the full regulator-led exercise conducted in late 2014
Nonetheless, underlying operating margins were largely maintained, so that
underlying earnings during the scenario were of a similar magnitude to reported credit losses, so that return on assets averaged around zero.
In a very severe adverse scenario, banks did not make losses. They simply did not make any profits.
But risk-weighted capital ratios still fell.
Although projected credit losses were largely absorbed with underlying profitability, capital ratios were expected to decline throughout the scenario. This reflected an increase in the average risk weight from around 50 to 70 percent, due to negative ratings migrations (rising probability of borrower defaults) and falling collateral values (rising losses given default).
In fact, although risk-weighted capital ratios fell during the scenario, simple leverage ratios, of total capital to total assets, (while not reported) are likely to have increased. The dollar value of capital did not fall (no overall losses) while in estimating how the Reserve Bank’s severe shock would affect them and their businesses, banks generated results which implied a decline in credit exposures by 11 per cent. The Reserve Bank does not like leverage ratios, but most other regulators and analysts see a useful place for them – the OECD, for example, used to regularly urge New Zealand to adopt them.
And here, for completeness, is that Reserve Bank’s chart of how the capital ratios behaved.
C2: Capital ratios relative to respective minimum requirements (% of risk-weighted assets)

The regulatory minimum is zero on this chart, so banks were well away from that, even after this severe adverse shock – and, of course, regulatory minima have been increased since before the 2008/09 downturn. The grey area is the so-called “conservation buffer” and as the Reserve Bank notes
the average bank reported falling into the upper end of the capital conservation buffer in the final year of the test, which would trigger restrictions on dividend payments to shareholders (figure C2).
Since none of the big banks in New Zealand is listed, the temporary limitation on the ability to pay a dividend is unlikely to be too troubling. Banks don’t want to be in the conservation buffer, and will seek to get out of it again. But carry the scenario forward a year or two and on the basis of normal earnings they would probably get back there fairly quickly. What each bank might actually do might, of course, depend on the health of its parent – if the parents were experiencing a similar adverse scenario in Australia, the market and management pressures on the New Zealand subsidiary to quickly restore capital buffers would be materially greater.
Despite all this essentially “good news” story – savage recession, huge unemployment, severe falls in leveraged asset prices, and yet the banking system is still in pretty good shape – the Reserve Bank has never really been happy with the story. That is implicit in the FSR and, from what I hear, also the story they tell people who come to visit them.
I think there is a variety of reasons for that, including innate regulator/central banker caution. Some of that attitude is a good thing, provided it is conditioned by a good understanding of how systemic banking crises in other places/times have actually developed. Here it doesn’t seem to be.
They also seem uneasy because their scenarios do not consciously take account of any second-round effects of the reduction in credit exposures the banks would effect as part of the response to the extreme adverse scenario. As noted above, banks estimated that their credit exposures would fall by 11 per cent. The Reserve Bank has long worried that such a reduction in the stock of credit would act as an additional factor amplifying the economic downturn and the fall in asset prices, such that the initial macro scenario they set out for the banks was no longer sufficiently demanding.
In principle, it is a fair point. In practice, I think it is misplaced for two main reasons.
The first is that in developing their severe economic scenario they will have benchmarked it against other really nasty downturns in other times/places. But any additional impact of forced bank deleveraging – over and above the initial shock that triggered the downturn – will already be included in the GDP/unemployment and asset price numbers we see. The 1991 downturn in New Zealand included any additional impact from the BNZ and DFC failures, the post 2007 US recession included any deleveraging impacts from all the financial institution failure and additional lender caution, and so on. It would be double-counting to take as extreme a scenario as the Reserve Bank is using, and then add a whole new downturn on top of that, as banks pulled in their lending horns.
The second reason is that it doesn’t look as though the Reserve Bank has given anything like adequate weight to the way in which the size of a mortgage book is driven primarily by house prices and housing turnover. In the FSR discussion, they do note that the reduction in credit exposures “could reflect a reduction in customer demand” – there is less investment etc in recessions for example – this seems a very weak statement of what would be likely to occur with bank mortgage books in particular.
A while ago, I ran a chart illustrating the way in which a simple initial shock to house prices goes on raising household debt to income ratios for years afterwards, even if there is no subsequent further increase in house prices. That occurs just because the housing stock turns over relatively slowly, and so after prices move to a new high level it takes years for all purchases to have taken place at the new higher price (and associated higher need for credit).
This was that chart. Price double in year 1, are unchanged thereafter, and borrower LVRs are the same after the initial shock as they were before.

In fact, in housing booms typically involve borrowers and lenders becoming less risk-averse and housing turnover increasing.

You can see the difference higher initial LVRs and slower repayments make – it still takes years for debt to income ratios to reach a new steady-state level, and the process will happen more or less automatically, unless banks actively stand in the way. Turnover and prices drive mortgage books. When both increase, banks’ credit exposure will increase without them really trying.
But the same process can happen in reverse.
Recall that in the Reserve Bank’s scenario house prices fall by 40 per cent (and 55 per cent in Auckland.) I’m assuming that the 40 per cent applies to the rest of the country, so lets say nationwide house prices fall by 45 per cent. Each new house being purchased, even if the initial LVRs stay the same, now takes 45 per cent smaller mortgages than was required before house prices fell.
But in downturns, it isn’t only prices that fall. In fact, turnover often falls first. Sellers are reluctant to sell below purchase price, and many people are just genuinely uncertain. Economic downturns leave potential buyers more cautious too. The drops in turnover can be very substantial. Even in New Zealand, house sales per capita over 2008 to 2011 were only around half the rate seen at the peak of the boom in 2003. Housing mortgage approvals data only start at the end of 2003, but the same sort of fall is evident in approvals – and this is a recession much less severe than the one in the Reserve Bank’s stress test scenario, and in which house prices fell by only around 10 to 15 per cent.
So what happens to the volume of housing credit outstanding if we assume:
- house prices nationwide fall by 45 per cent, and stay at that low level thereafter
- housing turnover (and new mortgages) fall by 50 per cent and stay at that low level for five years, before reverting to normal.
In the base scenario (the first chart above), we assumed prices double in year 1. That produced a stock of debt which rose substantially in the first few years, and then kept rising slowly thereafter for many years. Lets assume the severe adverse shock happens in year 10. This is what happens to the stock of housing mortgage debt in the two scenarios.
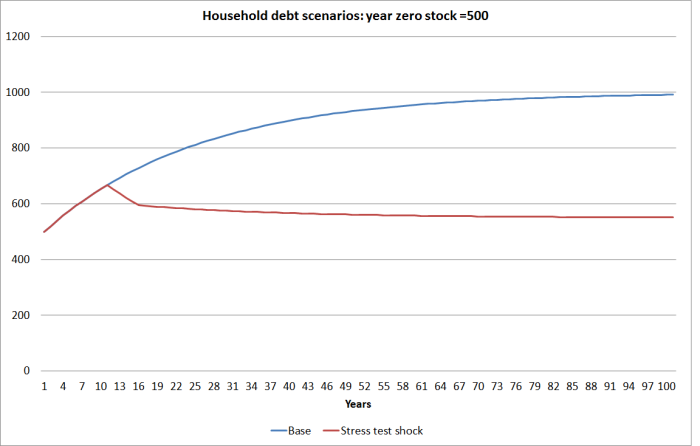
The differences are really large, without the banks even trying. The housing market does it for them. Within five years of the severe adverse shock, the stock of household mortgage debt is 10 per cent lower than it was just before the shock hit, and 20 per cent lower than it would be in the base scenario (where continuing turnover at the higher initial house prices carried household debt continually higher). Even when turnover returns to normal, the stock of credit keeps dropping, just because new purchases are at the new much lower prices.
These scenarios are only illustrative, but they illustrate a key point: turnover and house prices drive the size of mortgage books, independently of any active choices banks make. It seems quite plausible that bank balance sheets would shrink quite materially in the years following a shock like the stress test scenario, without the banks having to do very much active at all. Between lower turnover and low prices on both the housing and dairy books on the one hand and lower investment demand on account of the weaker economy on the other, there would be big savings in required capital simply from these customer choices.
Of course, in severe downturns, borrowers tend to be more cautious about how much they are willing to borrow – and so it is quite plausible that borrower LVRs would shrink in the course of a shakeout like this, even without action by the banks. That would further reduce the stock of debt.
And, of course, in a savage downturn of this sort one would have to expect banks to alter their lending standards – pull in their horns. This is something the Reserve Bank has never seemed comfortable with. Way back in April 2008, just as the 2008/09 recession was beginning to become apparent, the then Governor was saying openly
Banks should avoid overreacting to the economic downturn, Reserve Bank Governor Alan Bollard told the Marlborough Chamber of Commerce today. “The New Zealand economy remains fundamentally sound and creditworthy,” he said.
“Banks, businesses and households alike need to recognise the new external environment and adopt a cautious approach – but don’t go into hibernation, the underlying economy remains robust,” he said.
In fact, the only sensible reaction of both banks and businesses, going into what proved to be a severe recession, from which in some respects the economy has still not fully recovered, was to pull in their horns. That was especially so as the economy had quite severely overheated during the previous boom, and in some areas – property development and dairy in particular – credit standards had deterioriated very sharply during the boom. The recession would prove that some of the critical assumptions – by borrowers and lenders – made during the boom were misplaced. In the middle of the downturn no one knows what the correct “new normal” actually is, and considerably greater caution – by lenders and borrowers – was quite appropriate. The only prudent step was to stop and reassess.
So it would be in a downturn – a savage downturn – of the sort in the stress test scenario. Central bankers might win political brownie points by urging banks to keep lending. But it isn’t obvious that it would be good business – no Governor knows the future, any more than bankers and borrowers do. Things no doubt do return to some sort of normal eventually, but as we’ve seen – even in non-crisis in New Zealand – quite when and how is a very open question. And as I noted earlier, all those severe downturns that the Reserve Bank used to benchmark its stress test scenarios already included any pulling in of horns by banks (and borrowers).
This has become rather too long a post, so I will stop here. Bank supervisors should never on their laurels. Bank, and borrower, behavior can change quite quickly and the quality of loan books can deteriorate quite alarmingly quickly – and often does in the few years just before crises. But on the stress tests the Reserve Bank has presented, and the supporting analysis the Bank has provided, there is little sign of anything other than a reasonably cautious prudent banking system, with robust capital buffers to cope with even seriously adverse shocks. If the Reserve Bank wants to keep on imposing more and more controls, the onus really should be on it to show us what is wrong with its own published analysis and stress test results.

And if you run the Diary stress test and Housing stress test at the same time (not rocket science to assume this is not only possible but probable), what happens then….
LikeLike
so some extent they did. note that in the 2015 scenario it included a 40% fall in commercial and rural property values. 40% was the fall they assumed in dairy farm prices in the dairy stress test. Not sure if they allowed for a dairy income shock, but NZ downturns are usually associated with at least some sort of downturn in farm commodity prices..
LikeLike
There is no logic in a stress test in falling House or farm equity values. Falling House or Farm equity values do not directly impact on a banks balance sheet.
Scenario 1, What does impact on a banks balance sheet is when a loan becomes non performing ie the general economy gets so bad and job losses start to mount. That results in asset impairment.
Scenario 2, The other side is a run on savings, ie savers demand the return of their savings however with the introduction of the OBR the risk of a run on savings has been significantly reduced. If a run occurs, the RBNZ steps in a freezes a banks trading operations in effect stopping a run on savings immediately. The next step is then to give savers a haircut to reinstate the net asset position effectively returning the bank to a healthy balance sheet.
Scenario 3, is something which is not well understood by many NZ economists and their respective academics and that is likely due to a complete ignorance of how a balance sheet works. Savings rising too fast equates to net asset impairment to a banks balance sheet. With inflation targetting, as the economy starts to boom away , under Monetary Policy, the natural response by the RBNZ governor would be to push interest rates upwards. As interest rates rise, savings become an attractive investment opportunity. Contrary to what many economists believe, higher interest rates do not lead to higher investments in the productive sector(other than property) it leads to higher costs for the bank and increasing liabilities. Push interest rates too high, too fast and you in effect create bank instability.
Whatever the bank takes in as savings must be on lent. Higher savings lead to higher borrowings for the bank to balance their books. When Alan Bollard drove interest rates towards 10% he drove what was a strong economy into a deep recession, decimated the building industry and decimated 61 plus finance companies funding the building industry. Our traditional risk adverse banks also started getting heavily into low documentation loans and bank managers had independent credit approval authority as high as $2 million in effect the credit risk department was asked to step back from any risk assessments between 2004 to 2007.
LikeLike
Kathryn Ryan, Radio NZ 101.4 today had a chat with Steven Joyce. It was clear that Kathryn was attempting to drive Steven Joyce in his capacity as the Science and Innovation minister towards admitting that New Zealanders overinvestment in property was the reason for the underinvestment in other more equity based more productive industries. Steven Joyce did a fantastic job in making it clear that ordinary people invest in areas that they are comfortable with. People that are familiar with property will invest in property and himself as he was familiar with equity started his first investments in his youth in equities.
To imagine an ordinary mum and dad investor deciding to invest as an angel investor in NZ newest space industry with its associated high risk of loss is rather a ridiculous idea. Anyone involved in angel investment know that you invest in 10 ventures to get 1 very successful venture. The risk of failure is extremely high. This nonsense about mum and dad investors turning their backs on investment property and investing in high risk productive enterprises is just not going to happen.
Kathryn again made very little sense trying to paint property investment as the root of our investment problems. Firstly, when there is a shortage of supply how can there be an overinvestment in property? It is rather silly a concept but surprisingly common amongst many NZ economists which is just financial nonsense. Building a house and building shelter is a very productive endeavour. It is in fact our very first productive endeavour meeting one of basic primal need, ie the need for shelter. How is that not productive?
LikeLike
Hi,
I think it is great you are focusing on and writing about financial stability and regulatory issues.
I have not looked at the most recent tests. In discussions of previous tests one feature that stands out as critical to the outcome is that the banks remain very profitable compared with other countries experience and are able to quickly rebuild capital. Whether one should expect this to be the case is I think a key uncertainty. This, I think, is a key feature that requires ever more severe economic assumption in the test to show sufficient banking sector distress to accord with policy makers priors.
I think the history of past unreliability of stress tests is a good reason to take the results with a great deal of caution. Haldane set this out pretty clearly here http://www.bis.org/review/r090219d.pdf. Now some would say the problem have been ‘fixed’. But the incentives on the players and the players remain largely unchanged. It would be an interesting exercise to see which of his 5 suggestions for stress testing have been applied by the RBNZ
Of course this does not mean that evidence is not required about the efficacy of additional measures. And perhaps more importantly why, if you were worried about bank stability, the answer isn’t to raise capital adequacy further like many jurisdictions.
MDM
LikeLike
Interesting comments. Of course, many of Haldane’s comments about the past were directed to banks’ own stress tests, with a particular focus on market risk.
But if one takes his five point plan for the future, I think the RB/APRA tests pass pretty well:
1. The stress scenarios have been set by the authorities and have been very demanding (and generally accepted as such)
2. There has been a reasonable amount of updating using similar scenarios, and the tests have been done on all large institutions at once, allowing the RB to compare and contrast initial results, and encourage some revision of some results in light of that information
3. Although they don’t explicitly look at the second round effects, their baseline scenarios have been so extreme that they would encompass the worst shakeouts seen in other countries, even with second round effects (ie what we see in the US, say, includes first, second and subsequent rounds of effects, not just the initial shock)
4. The RB has actually sought answers from banks as to how they would respond, including the choice between raising capital and cutting exposures
5. The results have been fairly transparent, esp to the RB but also to outside observers.
Perhaps the biggest reassurance is probably that this is an RB that wants to find problems – it would suit them to find worse results than they do, as that would provide more cover for their regulatory interventions. I still recall the internal seminar I went to in 2014 when the first results of that set of stress tests were coming thru – most of us didn’t want to believe the results, we were pushing and prodding for how to worsen them.
I think the other big difference between the sort of scenario Haldane was addressing in the UK context, and the NZ situation, is the complexity of the instruments. NZ bank balance sheets are extremely vanilla, in a way that those of many of the large institutions that failed in 2008/09 weren’t.
LikeLike