I’ve written several times about the apparent economic underperformance of Auckland – apparent, that is, in the official annual regional GDP per capita data that Statistics New Zealand publishes.
We only have the data for the period since 2000, and no doubt more recent periods in particular will be subject to revisions. And there is noise in the data from year to year. But whereas in 2000 average GDP per capita is estimated to have been 24 per cent above that in the rest of New Zealand, by the year to March 2015, that margin had shrunk to only 12 per cent.
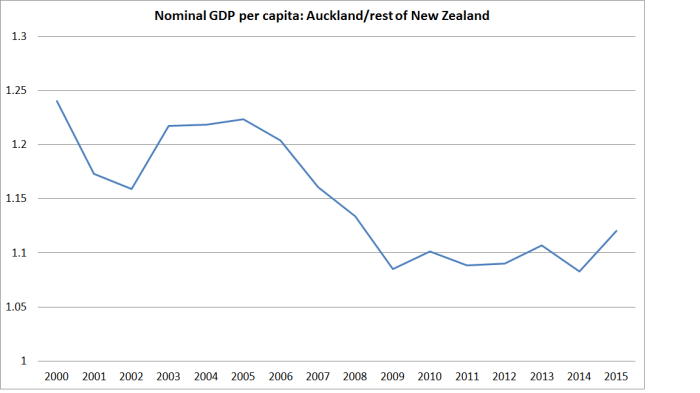
That shouldn’t have been happening if the advocates of our “economic strategy” had been correct: between the agglomeration gains from cities, a rapidly rising population increasingly concentrating the population in our one moderately-large city, and all the claimed spillover effects from a skills-based immigration programme, everything should have been set for Auckland to have continued to outstrip the rest of New Zealand. But it just hasn’t happened – if anything, rather the reverse. As I noted the other day, Census data suggest that until the mid 1990s more New Zealanders were moving to Auckland than were leaving. But even that flow has reversed (albeit on a small scale) over the years since then – the years that coincide with Auckland’s relative per capita economic decline.
There aren’t comparable official data in Australia (regional GDP data are all at a state level), but in the US the BEA publishes real per capita GDP estimates for each of the metropolitan statistical areas (MSAs). The data are available from 2001 to 2014.
Here is a chart showing the median real GDP per capita for six areas people often think of when they think of the economic success of US cities (Boston, Houston, New York, San Francisco, San Jose, and Washington DC ) relative to GDP per capita for the US as a whole.
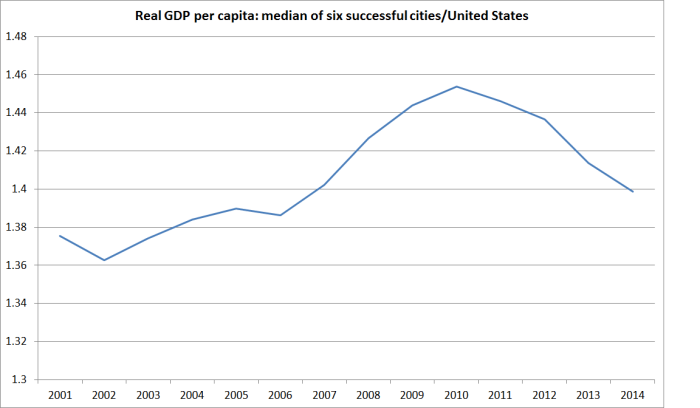
There is some variability, but over these 13 years as a whole average per capita incomes in these cities – already much higher relative to the rest of the country than is the case in Auckland – have increased a little further. The change over the full period isn’t large – but nor would one expect it to have been. But the change is in the direction one would have expected.
Those six cities aren’t all of the biggest MSAs in the United States. The others in the top twelve (each with populations above 4.5 million) are centred on Chicago, Dallas, Miami, Los Angeles, Atlanta, Philadelphia. If we take the whole group of 12 cities, the median city had average GDP per capita 24 per cent higher than that in the United States as a whole in 2001. In 2014, that margin has increased to 29.7 per cent.
Of course, in a country with a lot of big cities there is quite a diversity of experiences (different shocks, changing opportunities etc). In five of these twelve MSAs, average GDP per capita had actually fallen relative to the US as a whole over this thirteen year period. Most of the falls were pretty small, and might be not much more than normal year to year variance. But Atlanta did stand out.
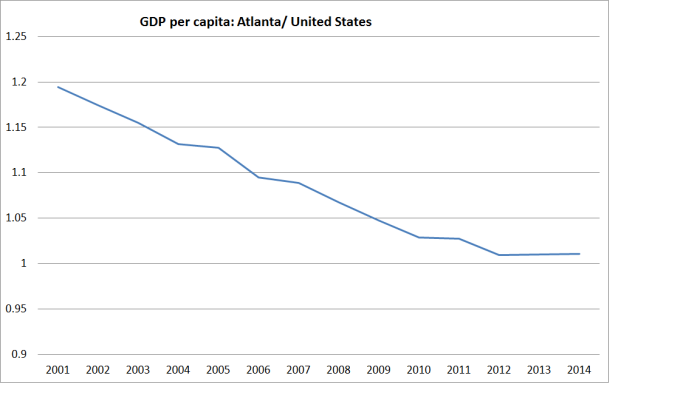
The fall, relative to the rest of the United States, has been even larger than the relative decline of Auckland.
I don’t know much about the Atlanta economy. There has been very rapid population growth – from just over 4 million people in 2001, to around 5.7 million now. And they have managed that growth while having median house prices of around US$180000, and a price to income ratio near 3. That is major achievement in its own right. But it is also one that makes me a little skeptical of claims that fixing Auckland’s dysfunctional housing and land supply market would materially boost per capita income prospects in Auckland (a claim the Productivity Commission has signed up to).
Auckland’s economic underperformance is real, and should be troubling. It isn’t a “quality problem“, but reflects a serious failure of the economic strategy pursued by both this government and its predecessor. Fixing the land supply market should be a policy priority in its own right, but it looks like a quite different issue to fixing the issues around Auckland’s overall economic underperformance. That looks more like the fruit of an immigration policy that funnels huge numbers of people into Auckland, which doesn’t seem to be a natural location for generating lots of highly-remunerative economic opportunities. When our largest city has so badly underperformed over fifteen years, despite all the hopes and aspirations, it is time for politicians and official agencies to start facing up to the uncomfortable data.

Michael I am really enjoying your cities articles -you offer really good insights : )
With regard to Atlanta -it may be its extreme low average density of 6 people per hectare, which accounts for the fact it is not benefiting from agglomeration, connectivity etc from its city form. In comparison the figure for Auckland is 28.
(see page 6 graph on the following link http://alain-bertaud.com/AB_Files/AB_Central%20European%20Spatial%20Structure_Figures_2.pdf)
So maybe a successful city needs a degree of density -to gain the advantages of agglomeration, connectivity…. while at the same time requiring a degree of affordability so that those potential advantages are not being syphoned away by residents and businesses paying excessively high property prices?
LikeLike
Interesting idea Brendon. I’d be a little surprised if that was the story – esp as a agglomeration gains are prob more about employment density (closeness of firms) than residential density. But the Atlanta data have got me curious and I will dig around some more.
LikeLike
Atlanta and Auckland have both had population growth, is there any sort of correlation between GDP/capita and population growth in those cities?
LikeLike
I’ll check more carefully at some stage, but in general I’d expect the answer to be no (or, if anything, a positive correlation – since people tend to flow towards opportunity. That is certainly so within countries where there are no immigration policies (choice between LA and Houston is all about opportunities incl housing costs). Akld’s situation is a little different because the trend population growth is mostly now arising from an exogenous force immigration policy.
LikeLike
Continuing good work on the realities of the NZ economy
1. You have committed the cardinal sin of truncating the y-axis in your graph on Atlanta to make the slope of the graph appear worse than it is.
2. Curmudgeonly grumbles aside, I think some of the explanation of the relative performance of Atlanta/Texan cities v San Jose is sorting between cities.
There is some evidence that less glamorous tech companies are exiting Silicon Valley in favour of low housing cost locations. Brendon often draws parallels to the Corn Laws era. One of the reasons that manufacturers supported the repeal of the Corn Laws was to lower the living costs of their employees and, therefore, to lower upward pressure on wages. Anecdotally this could also be happening in the US.
Looking at the situation this way Auckland does not look good.
LikeLike
in my defence….the y axis scale on the Akld chart is much the same as that on the Atlanta chart. Key point here is that over 15 years one wouldn’t really expect much change: say the agglomeration gains were worth another 0.3 pps of growth pa over 15 years that cumulates to only around a 5 pps change in the ratio of GDP pc in the big city relative to the rest of the country. Neither AKld nor Atlanta are poor cities, but they have been in relative decline
Re Texas, Houston’s pc GDP has been unchanged relative to the rest of the US over the 15 years, and in Dallas GDP pc has increased relative to that for the country as a whole.
LikeLike
1. When economists talk about productivity in a location do they measure GDP/capita or do they sum the productivity of the individual enterprises? If the latter then it is possible that AKL’s productivity has been steadily rising while GDP/capita has been falling. All it takes is more people on average outside the measured economy compared to rest of NZ. I appreciate you have been consistent in your use of terms but the rest of the world could easily be talking at cross-purposes.
2. Did the PC really say that? It’s obvious that falling accommodation costs would likely lead to increased standard of living at the household level and increased profitability at the firm level. But increased real incomes is a big claim.
LikeLike
These results are all GDP per capita (here and abroad). I’m not sure there is reason to think there would be more people outside the measured eonoomy in Akld than elsewhere – last time I checked the labour force participation rate in Akld didn’t stand out.
Re the PC, yes they sounded quite attracted to the one academic paper from the US which suggested that lower land use restrictions would generate quite large GDP pc payoffs.
LikeLike