I don’t usually look at Sunday’s Herald but I was filling in time in an airport yesterday and noticed an article on private residential rents, drawing on MBIE’s tenancy bond database. I don’t think I had previously realised that the data were easily available, at both a TLA and regional level.
One of the striking aspects of the house price boom has been the way rents have lagged well behind house prices. House price to rent ratios have increased substantially. Of course, in many ways that should be no surprise. After all, real interest rates have fallen very substantially over the last 25 years or so (having risen sharply over the previous decade). Even in New Zealand – with the highest real interest rates in the advanced world – real interest rates are lower than at any time in modern history (the heavily regulated period of the 1970s and early 1980s excepted). Falling rental yields might reasonably have been expected, and that is what we have seen.
The MBIE data go back to the start of 1993. Since then, consumer prices (the CPI) have risen by around 60 per cent. Average private rents on this measure have risen by about 150 per cent in that period. The QV measure of house prices has risen by just over 300 per cent in that time.
Perhaps what is most striking, and something the Herald article didn’t bring out, is how similar Auckland’s experience has been to that of much of the rest of the country. Since the start of 1991, Auckland rents, on this measure, have risen by 158 per cent. Those in Gisborne – the median regional council – have risen by 130 per cent. Auckland rents have risen faster than those in most of the country, but they just don’t stand out the way that the increases in Auckland house prices do.
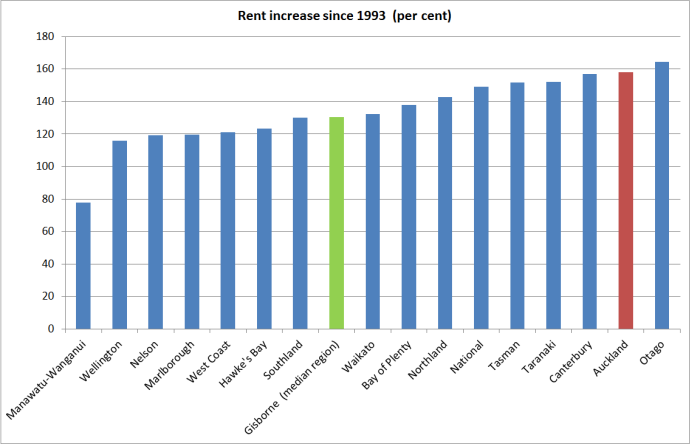
And if we restrict the analysis simply to the period since, say, 2007, the picture is not materially different.

And what of incomes? Nominal GDP per capita increased by 144 per cent from 1992q4 to 2015q2. Even in Auckland, rents have not increased much relative to (national) average per capita GDP. Purchasing a house might have become “unaffordable” for many, but accommodation doesn’t appear to have.
And that conclusion is reinforced when one recognises that these MBIE data do not purport to be like for like measures. The average house today is larger than the average house in 1993. The average house is better appointed now than in 1993 (more likely to have double-glazing, heat pumps, or central heating). And as the home ownership rate has dropped in the intervening years, it is likely that the median rental property in 2015 is further up the 2015 spectrum of New Zealand houses than the median rental property in 1993 would have been along the spectrum of New Zealand houses in 1993.
In the CPI, Statistics New Zealand attempts to adjust for the quality and compositional issues. However, they only appear to report, in Infoshare, rental prices since 1999. And even that series, which includes both public rentals and private rentals, is made harder to read by the abandonment of market-related rents for state houses in 2000/01. But since 2001 (ie after the levels adjustment from the policy change), the CPI rentals component has risen by 37 per cent (very similar to the change in the CPI over that period), whereas the MBIE private rents series has risen by 87 per cent. Per capita nominal incomes have risen by 71 per cent over that same period. Even over the period of the biggest house price boom in modern history, a constant-quality house looks to have become more affordable to rent, not less. And, of course, that is what one would normally expect. Stable long-term ratios of house prices to incomes, for example, tend to reflect the fact that as incomes rise, the size and quality of houses tends to increase.
Of course, if land use restrictions – in conjunction with policy-driven population pressures – had not driven urban land (and house) prices sky high, we might perhaps have expected to see real rents falling. All else equal – which it never is – sustained lower real interest rate lower the real cost of providing rental accommodation services. But the fact that Auckland rents have not increased enormously relative to those in the rest of the country tends to reinforce the idea that it is not so much an issue of an extreme shortage of accommodation in Auckland, as of the regulatory restrictions on land use. Such restrictions, which “bite” more in Auckland because of the population pressures, offer returns to landlords through actual/expected capital gains.
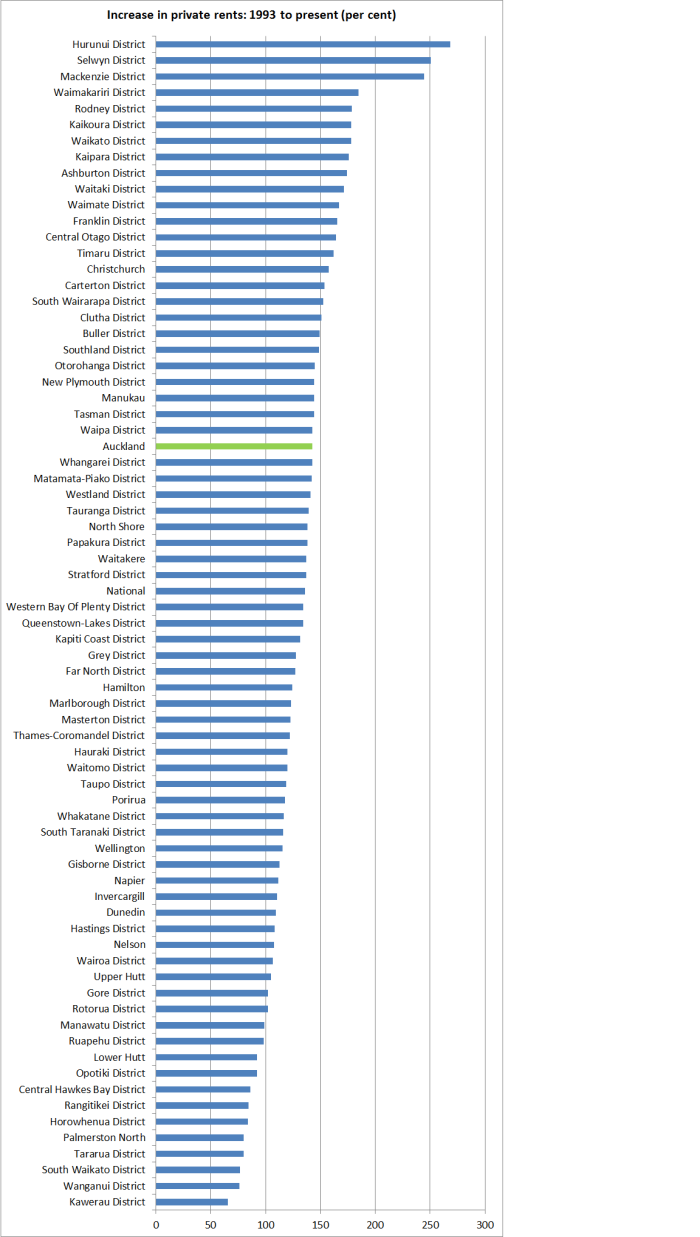
And for anyone interested in the rental increases at the TLA level, here is that chart. (To deal with a few missing observations at the start of the period, this chart uses the percentage increases from the first 12 months of the series to the most recent 12 months).

“But the fact that Auckland rents have not increased enormously relative to those in the rest of the country tends to reinforce the idea that it is not so much an issue of an extreme shortage of accommodation in Auckland, as of the regulatory restrictions on land use. Such restrictions, which “bite” more in Auckland because of the population pressures, offer returns to landlords through actual/expected capital gains.”
I don’t understand why rents should be unaffected by land-use restrictions (or even less affected) relative to prices? Don’t prices reflect cashflows (ie, rent actual or imputed)? Capital gains should reflect an actual increase in cashflows (rents increase), or a lower discount rate at which the cashflows are capitalized (lower interest rates). The data above seem to suggest the latter, to the exclusion of the former.
I can think of two possibilities:
1. Prices today factor in tomorrow’s rent increases (as land-use restrictions are forecast to become more binding in the face of growing demand. So it is land-use restrictions that are the problem.
2. Property bubble. It’s not land-use restrictions that are the problem (well, to a lesser degree than previously suggested).
LikeLike
Actual and expected capital gains might just reflect the heightened scarcity of urban land (regulatorily driven). We know from surveys that investors seem to have unsustainably high expectations of future capital gains, but those expectations are as they are. If there are (broadly) enough houses but not enough urban land – so land becomes the scarce factor – potentials renters won’t be rushing to pay more, and landlords will have achieved there target expected rate of return through a mix of low rental yields and an extrapolation of expected capital gains. At some point, it prob means either low house prices or higher rents – the former if incomes/population etc don’t support an aggressive bidding up of rents. At least, unless our OCR is eventually heading towards zero like most of the rest of the OECD.
LikeLike
Its not just the capital gain but the negative gearing which also needs to be considered.
LikeLike
When 65% of properties are owned and not rented, rental income only affect 35% of properties. Other income such as business income, wages and also overseas income come into play therefore rents only play a part but is not a primary variable. Note that 25% of New Zealanders are migrants, ie 1,000,000 people that may have income from overseas jusrisdictions and also there are an equivalent 1,000,000 New Zealanders that do reside overseas that use overseas income to buy in NZ, overseas income is not factored into NZ disposable income. New Zealanders are highly migratory and the number of ordinary kiwis that hold significant undisclosed overseas income assets would surprise many of us.
LikeLike
There is no property bubble in Auckland. Auckland house prices are driven by future potential, largely driven by the Unitary Plan. On all the Mixed Housing zones, Single, Suburban or Apartments/Terrace Housing the Unitary Plan allows for a Secondary Dwelling to be erected attached to the main house but allows for a separate kitchen. No additional parking space required. The minimum size is 40sqm. In at least 10 suburbs, the density has been rezone up to 18 levels, multiunit and multilevel sites
Note the term “MINIMUM” For investors this means a MINIMUM potential of doubling of the income potential. For ordinary households an additional income from almost all Auckland residential houses without the inconvenience of taking in boarders.
LikeLike
But there are brand new houses with no subdivision potential (as the house sits over where you might subdivide) selling for very high prices. This suggests it is not the redevelopment potential driving the value.
LikeLike
Secondary dwelling does not require subdivision potential. All it needs is 40sqm building space attached to the main house. Can be on top of your existing garage or on top of your existing house.
LikeLike
Or an existing 2 level house split into 2 rentals.
LikeLike
Existing garage needs to be attached to the main house though if you want to build atop your existing garage.
LikeLike
There is a misconception that rents increments are tied to house price increases. Investors buy based on commercial logic whereas the home owner/maker buys on emotion. There are a lot more home makers that buy on emotion than there are investors. The price movers are the emotional mums and dads. Investors are usually price followers unless there is a commercial logic to upping the ante, ie income potential.
Investors are made up of 4 major groups. Each group operates quite differently.
1. 30 year plus investors
2. 20 year investors
3. 10 year investors
4. newbies
The debt levels for each of those groups are quite different and therefore the rents available as disposable income determine the behaviour. The group with the least debt decides how far rents rise. The newbies with the most debt have to wait until the oldies with the least debt decide when rents need to go up.
Contrary to market pricing, investors consider the most important tenant is not the highest paying tenant but the safest paying tenant which means that rents would be held back to retain the safest tenant ie the tenant that makes the most regular and consistent payments and the least likely to damage the property.
LikeLike
I had a similar reaction to Observer i.e. asset price theory which, given the ‘theory’ part, might not be the best way to react!! But I guess asset prices – including houses – have to ultimately reflect their ‘fundamental’ value at some point. Population growth, slow supply response and investor expectations for continued capital gains seem to be a material part of the picture but, is the marginal discount rate too low? Investing in property shouldn’t be considered a 100% safe bet especially given the use of debt within the financing mix (per ggs comment). While it is difficult to foresee, a rise in real interest rates abroad might put pressure on NZ banks offshore funding and ultimately domestic debt servicing costs: for home owners and investors. And if unemployment rises, wages (rather than nominal GDP per capita?) to pay the rent to service the mortgage debt might not be there when most required.
LikeLike
Permanent and Long term arrivals
12 months year ended October
2015
Residence 13,903
Student 27,480
Work 36,760
Visitor 5,490
NZ citizens 35,656
Other 834
Total 120,123
2014
Residence 13,471
Student 21,994
Work 32,603
Visitor 4,854
NZ citizens 33,446
Other 829
Total 107,197
2013
Residence 12,354
Student 15,104
Work 29,354
Visitor 4,505
NZ citizens 30,120
Other 706
Total 92,143
LikeLike
http://www.stats.govt.nz/browse_for_stats/population/Migration/IntTravelAndMigration_HOTPOct15.aspx
LikeLike
and?
LikeLiked by 1 person
You would expect that the governments target of 40,000 new migrant target would be breached in one of these years if you believe most students and workers end up with permanent residency but it is looking like the government has consistently kept real permanent arrivals – residency below the 40,000 target. Afterall most students or workers who end up with residency would at some point return to their home country and be recorded as a resident arrival, maybe not in the same year but most definitely in the following period.
LikeLike
But as I’ve noted previously, you are comparing two different things. The residence approvals process has no relationship to the PLT data – most residence approvals are granted to people who are already here on either student or work visas.
LikeLike
It may not bear an immediate relationship but eventually students and foreign workers in NZ granted residence would return home to tidy up their home affairs, bring their wives and children, organize their respective shipping containers and arrive at Auckland Airport and complete that arrival form which would then be picked up in the PLT data as a permanent residence arrival category.
The PLT data over the last 3 years show consistently around 13,000 permanent residence arrivals per year.
LikeLike
Another interesting and thoughtful article Michael, I can’t keep up.
It’s good the figures seem to corroborate my sense that rents go up with nominal GDP per capita via wages, or am I seeing what I want to see?
I am reading Michael Hudson at the moment and have been thinking about the tax system in NZ, no doubt heavily influenced by his views. Productive enterprise pays tax on turnover at 13% (ie GST at 15/115) PLUS tax on profit at 28%. It is thus very highly taxed and it no wonder firms have difficulty generating capital for growth. By contrast, Rental income is only taxed on profit not turnover. Bank income, ie interest, is only taxed on profit, not on turnover. The cumulative effect of this difference is geometric, not arithmetic.
My personal interests have moved out of manufacturing to property and finance, which is why I find this stuff so fascinating.
LikeLike
but remember that GST can be claimed back on inputs. it is a value-added tax not a turnover one.
On housing, since there is GST is construction costs (and land development costs) in principal rents have an implicit tax component in them (landlords not a dollar return determined by the cost of asset)
LikeLike