A friend asked me yesterday for the latest GDP per capita numbers for New Zealand and Australia. His interest was a point estimate, to compare current levels in the two countries. I went back to him with the series I would normally consider best for that purpose: the OECD’s measure of current price GDP per capita, converted to a common currency (usually USD) using the estimated purchasing power parity (PPP) exchange rates. Unlike constant price measures, current price measures take full account of changes in the terms of trade – which aren’t things governments can do much about, but which can materially affect living standards in countries like ours (in which the terms of trade are quite variable).
To my surprise, Australian per capita GDP on that measure was only about 22 per cent higher last year than New Zealand’s (= New Zealand’s being 18 per cent below Australia’s). And if one believed that measure, the last few years had been just great for New Zealand (at least relative to Australia). On this measure we’d long been drifting gradually further behind Australia, only to have experienced a startling reversal in the last few years. It was as if that once-upon-a-time goal of catching Australia by 2025 was coming into view, all without actually doing any significant economic policy reforms.

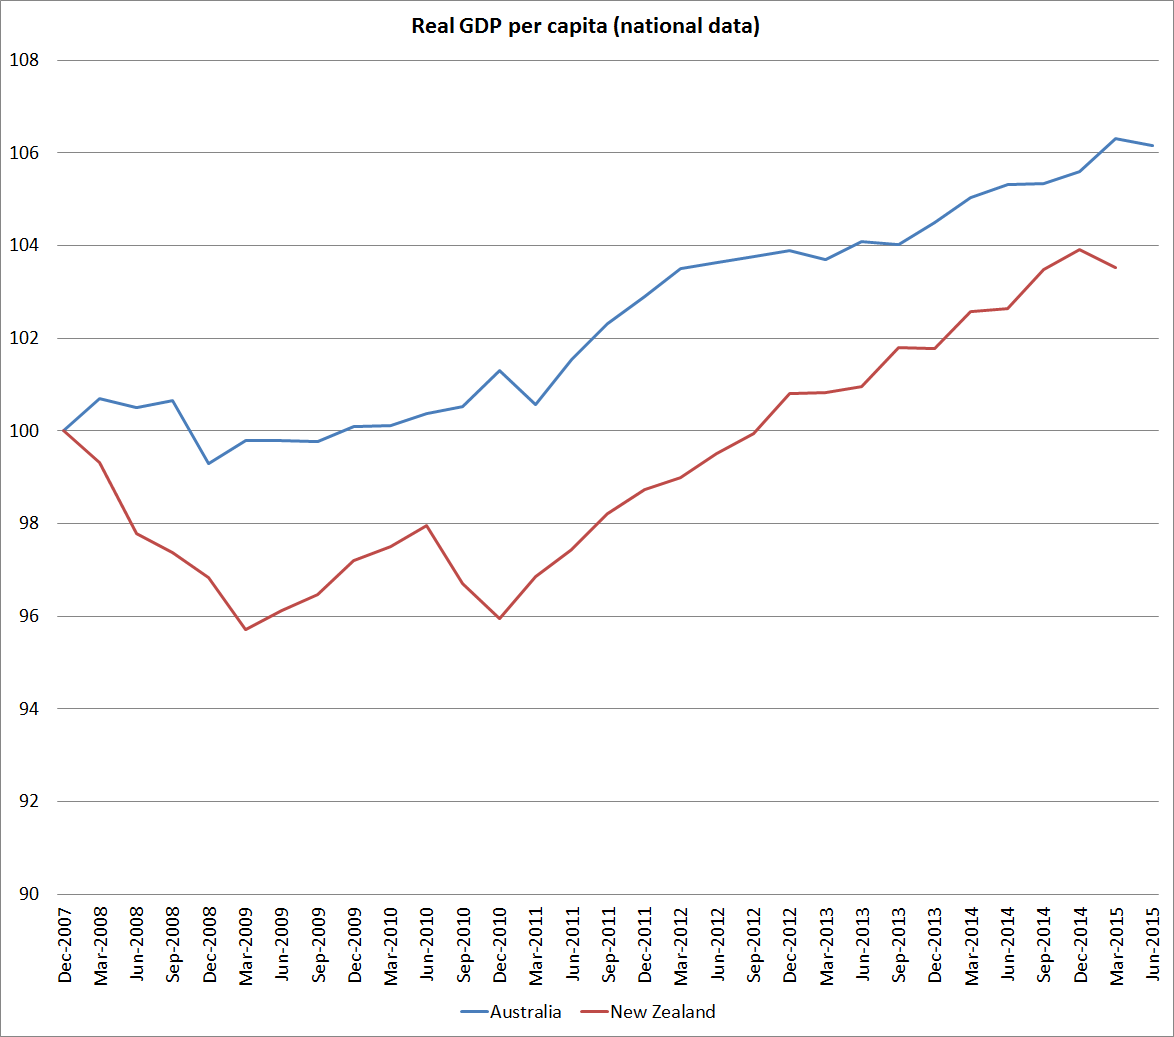
Of course, it was too good to be true. But it prompted me to have a look at a variety of other measures of how the two countries have done since 2007 (just prior to the global recession). I started with national data, calculated in local currencies, and deflated by domestic estimates of changes in prices.
Here is real GDP per capita for the two countries, where we’ve done a little worse than Australia.
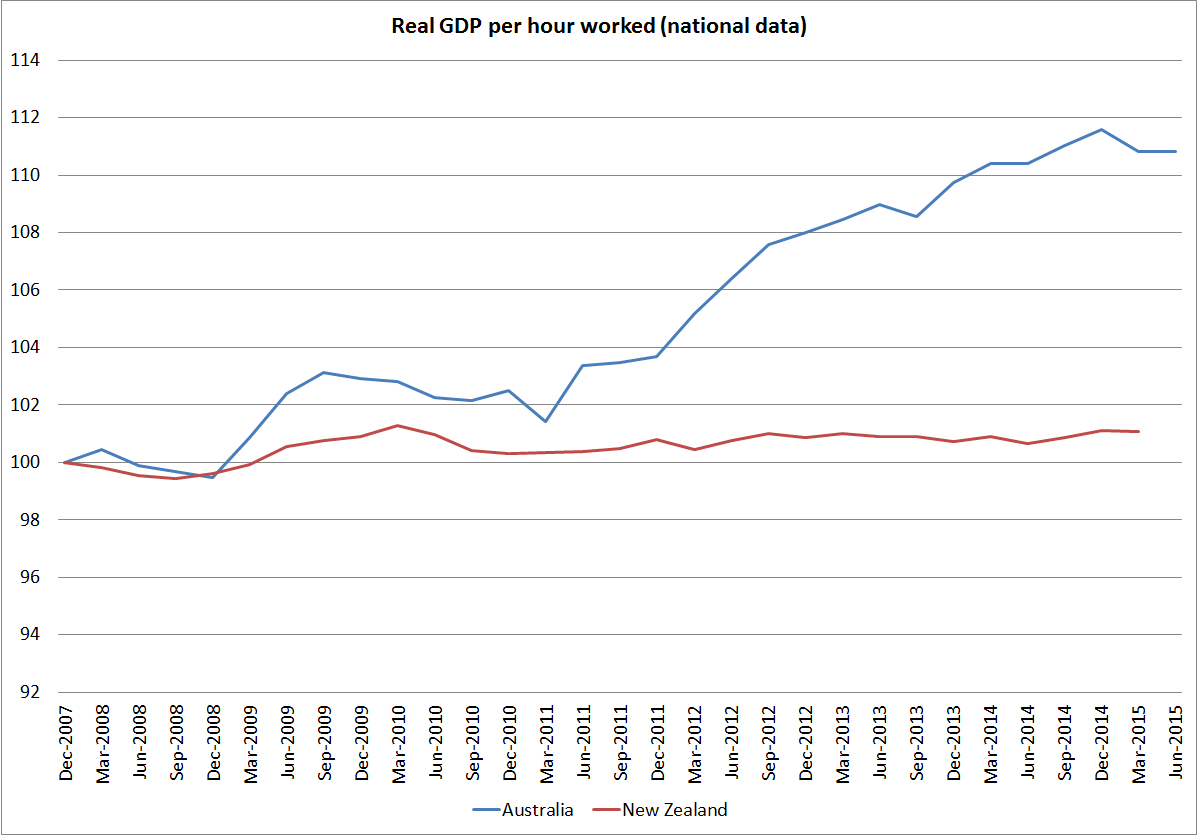
And here is real GDP per hour worked, where the differences are quite extraordinarily large (and not in New Zealand’s favour).
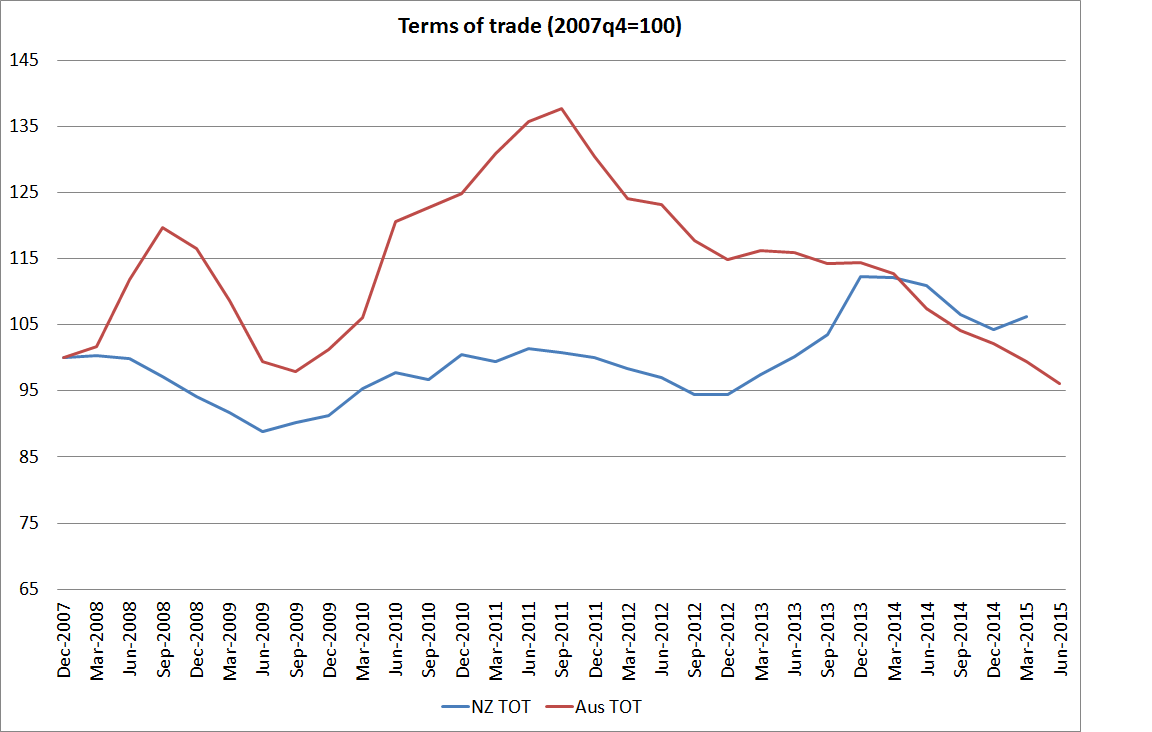
Australia’s terms of trade rocketed up over 2010 and 2011, but have since fallen back very sharply. Over the full period since 2007, we’ve now done a little better than them, and foreign trade is a larger share of our economy that it is of Australia’s.
And here are the two countries’ respective measures of real income, which take account of the effects of the terms of trade. We are now just slightly ahead of them over that full period.

And what about the international databases? The Conference Board has measures of real GDP per capita and real GDP per hour worked, converted to a common currency using PPP exchange rates. They have much the same picture as the national data.
Here is real GDP per capita – we’ve lagged further behind.

And real GDP per hour worked, where again the New Zealand numbers have been very poor.

And the OECD’s real (constant price) measures also show something similar. Here they use 2005 PPP exchange rates.


So none of these national or international measures suggest anything particularly encouraging about New Zealand’s performance in recent years. So far, our terms of trade have held up a bit better than Australia’s, but they are outside our control, and at best all that terms of trade strength has done is offset a lamentable productivity performance. And most observers expect our terms of trade to fall further (as, of course, may Australia’s).
Which brings us back to the OECD’s current price estimates. Here is how we are shown as having done relative to Australia since 2007.
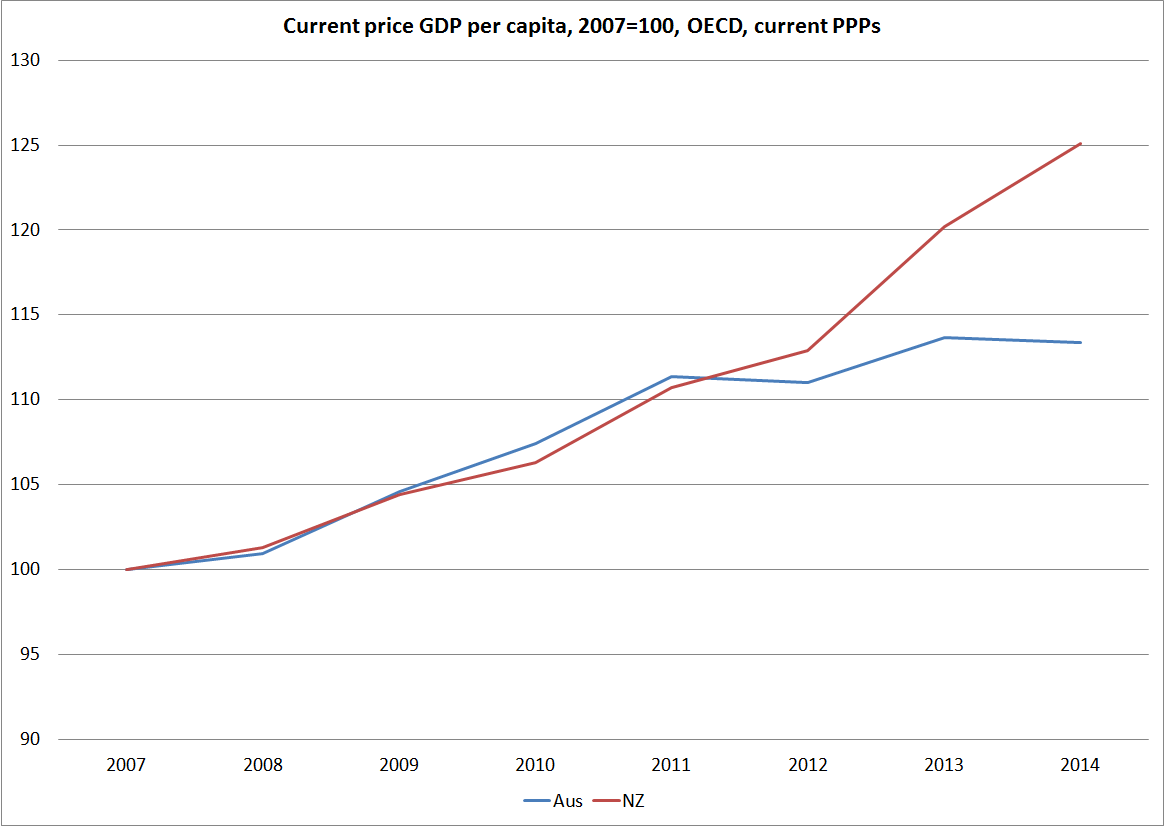
It looks too good to be true, and it is.
The OECD generates these numbers by converting national data into a common currency using estimated PPP exchange rates. PPP exchange rates are, broadly, the exchange rates that would equalise price levels in the respective countries. They can’t be directly observed and have to be estimated. For established advanced countries you would not expect the PPP exchange rates to fluctuate much, and the biggest influence over time will often be any differences in inflation rates. Thus, Australia has a slightly higher inflation target than New Zealand does, and Australia’s inflation rate has averaged a little higher than New Zealand’s over the inflation targeting period. That should have been reflected in a very gradual, quite modest, rise in the NZD/AUD PPP exchange rate.
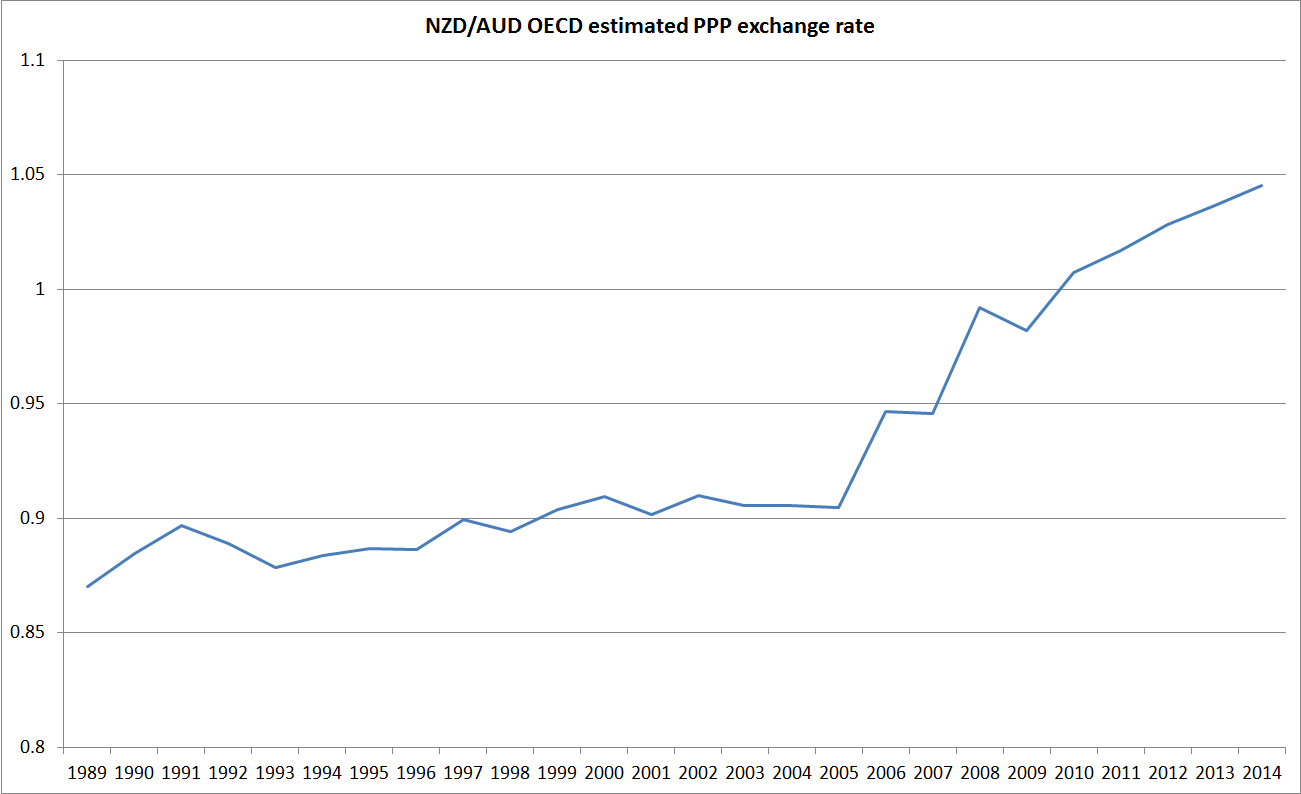
And that is exactly what we saw until 2005. But since then the OECD estimates that the exchange rate that would equalise prices in the two countries has risen by 15 per cent. It simply doesn’t seem plausible – there has been nothing that structural in the two countries that could explain such a change in such a short period of time. I’ve asked the New Zealand desk at the OECD if they have any idea what is going on, but in the meantime I will be steering very clear of the OECD’s current price estimates.
There is no one “right” international comparison of income/GDP levels. But whatever the “true” difference between Australia and New Zealand – perhaps 35-40 per cent – it remains large. On some key measures – notably productivity estimates – it has continued to widen. But then why would we be surprised? If we keep on with much the same policies why would we expect much different outcomes? New Zealand has been one of the least successful Western economies in recent decades – indeed, probably for the last 100 years. As I’ve highlighted previously, since 2007 many European countries have done extremely badly but even in that period, when floating exchange rate commodity exporters haven’t done as badly, we’ve not managed to make any progress in closing the large gap to Australia.
We can do better, and the failure to even start doing so reflects poorly on our political leaders and their senior official advisers, neither of whom seems to have a credible alternative strategy.

It is surprising to me that National’s political strategy, which I thought was to hew close to the centre, rule for a long time and make incremental improvements, has not yet generated detectable results (judging by productivity, for example). Australia has been in political chaos over that period and it hasn’t helped us catch up. (Of course, there is one more thing the NZ government could try, a simple administrative policy change that requires no legislation and enjoys 3 to 1 popular support But that will never happen…)
I thought this comment from a sharp young left-wing commentator was quite cutting: https://dimpost.wordpress.com/2015/09/08/state-of-play-2/. “These propaganda pieces are never botched because they’re core business… Which is enormously empowering to the left, because it means we get to set government policy from opposition if we can just make it popular enough.”
LikeLike
Australia might have had “political chaos” but without the coups and human dramas we’ve not had a majority government through that period, and when I used to read speeches by Craig Emerson I used to wish we had ministers with that sort of intellectual framework.
I think that Dim Post piece is excellent, but it really makes the point that this govt isn’t materially different from the previous one, and hence my comment about keeping the same policies and expecting a different outcome. Oh, they’ve done the odd small useful thing, but actually so did the previous govt, and they’ve done various things that represent a step backwards (we included a list in the 2025 report, and that was after only 1 and 2 years in office). One hears that Key looks to Holyoake as an inspiration, but on my reading of econ history that Holyoake govt did more reforming stuff than this one has. In fact, I once went thru the first three years of Key and the first three years of Muldoon with a colleague who had been around back then, and we concluded that Muldoon had done more in his first three years than Key had. And there hasn’t been much since then.
LikeLike
Muldoon was very busy, for sure, an energiser bunny for quite a while!
But not particularly productive – even after giving him the benefit of the doubt over his Think Big schemes. But they did seem a good idea at the time.
The worst policy change in his first term was, in my opinion, his first, scrapping the Douglas super scheme, with individualised accounts and with only two major differences from today’s KiwiSaver, which is, of course, non-compulsory and has multiple providers.
His action on super did give me a nice payout which enabled a cool garage and lots of concrete for my SAC financed house, but has always left me wondering, what if he had let it run?
And then I was a mfg business owner during his wage and price freeze – that was fun. No wage increases allowed, great, but easy to find excuses for price rises. Admittedly, the latter involved writing to some government dept but I soon got the hang of that!
Anyway, to get to my point, academic econ basically teaches me that governments can’t do much to increase long term economic growth, other than to increase potential GDP (infrastructure, education etc). That aside, the main domestic purpose of governments, it seems to me, (putting to one side war or foreign policy) is to alleviate hardship and generally facilitate upward mobility.
I think in this regard, Muldoon was streets ahead of Key.
A final point (before I return to my now urgent assignment) is that out of curiosity, a couple of months back, I looked at Muldoon’s last budget and compared the big numbers (like borrowings and social spending) to Germany’s today, and I wondered what the co-called crisis Douglas, now teamed with Lange, supposedly inherited was actually about!
Was it all just perceptions?
LikeLike
In fairness to Key, and Muldoon, recall that my comment was only about the 1975-78 term, when there was substantial liberalisation of the financial system, the end of many domestic subsidies, and substantial progress towards balancing the budget. Not being a fan of compulsory savings, I don’t count the scrapping of the Douglas scheme as a negative, but yes it does depend what one counts as important.
Re your final point, remember that Muldoon did not bring down a budget in 1984. The draft one being worked on at the time of the snap election showed very large deficits (8-9& of GDP from memory). As a “crisis” the events of mid 1984 were rather overstated – it was a liquidity crisis, in a fixed exchange rate, such as many countries have had before and since – but the underlying economic underperformance was very real. Muldoon was dealt a difficult hand – the very low terms of trade – but over his full term as PM he did relatively little (prudent – ie exclude Think Big) to respond and reposition the economy. Arguably, govts of the last 15 years, dealt a much better hand by international markets, are open to much the same criticism.
LikeLike
PPP ER looks almost exactly like relative CPI levels
LikeLike
over the full 25 years the cumulative changes in the two are not too dissimilar, but since 2005 (where the kink in the PPP chart is) the Aus CPI has risen less than 5 per cent faster than NZ’s, while the PPP exchange rate is estimated to have risen by almost 16%. That difference is quite enough to produce the weird current price OECD numbers.
LikeLike
Nothing surprising there.
When you bleed 30000 people a year since 1989-90 why would we expect our economy, wealth or any other indicator to be positive?
Adding 60k a year for the next few years will start the reversal.
We waste far too much money on Maori, Social welfare because we take that road and have the wrong incentives for business and investment.
Key and his lot are only about being in Power. Not about making Kiwi’s Proud and Wealthy. (well unless of course its the All Blacks and a stupid flag the represents nothing of who Kiwi’s are or want to be. Utter mediocrity.
But that’s the Nats for you.
LikeLike
Using GDP to measure any sort of success is part of the problem.
It just measures mass and not specifics.
We need to know”are we any better off this year than last year financially and asset wise”
What is our net worth as a nation, as individuals, because that’s what we can spend.
We want to know are we getting wealthier as a nation, not what floods we had last year or was more money wasted on welfare adding to GDP
As interest rates fall and buying prices fall our GDP measure has to shrink as less mass is going to measured. Conversely it went the other way previously and that makes the actual wealth measurement worse.
I see we are buying more cars than ever. Hmm well that increases GDP but it doesn’t correlate to increased wealth because most of the finance is borrowed offshore.
LikeLike
Except it appears that our GDP is doing very little in the way of increase at the moment. From todays Press, GDP has increased by about 0.5% in the last six months. More importantly the ANZ ‘Truckometer” volumes are reducing. From the ‘Truckometer’ numbers the indications are that we may not have any growth in the third quarter. Micheal’s criticism of our high cash rate setting may be coming true faster than he predicted.
LikeLike
Exactly Alasdair.
If the price of product we buy and use and interest rates is reducing then GDP has to fall. (reduces the turnover of the mass being measured). Haven’t seen this in NZ for along time.
More to come.
LikeLike