Reflecting further on the risks facing our banking system, I dug out some fairly long-term house price inflation data from the BIS for 19 OECD countries. I was slightly hesitant about doing so, because there is a risk of feeding the narrative that vanilla lending secured on residential property is likely to be an important independent element in any financial system stress. As the Norges Bank has pointed out, and as the Reserve Bank has affirmed, that just hasn’t been so historically. To the extent that the United States last decade may have appeared an exception, it is important to recall that the heavy role Congress and the Federal government played in driving down lending standards, and the non-vanilla nature of much of the lending.
But for what it is worth, here are a few charts. In all cases, the latest observations are for the December 2014 quarter, which is as up to date as the BIS data are.
Here are real house prices changes since 2007 (most countries had a peak in or around 2007).
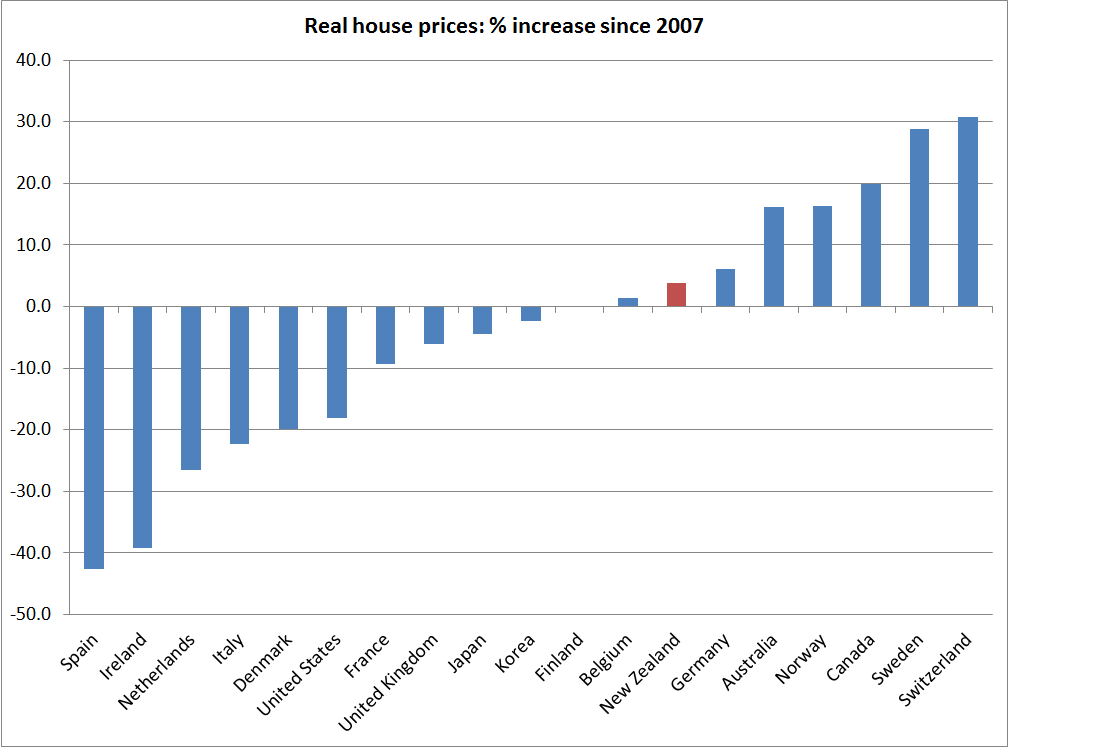
Real house prices in New Zealand have increased by less than those in Australia and Canada – and yet it is New Zealand banks that have been downgraded to BBB+, a rating not much higher than that held by South Canterbury Finance in 2008. As we’ve seen previously, New Zealand credit growth has done no more than roughly track nominal GDP growth over that period.
The BIS base their data at 1995. There is nothing special about 1995, although in most of these countries it was before any of the strongest house price booms had got underway.
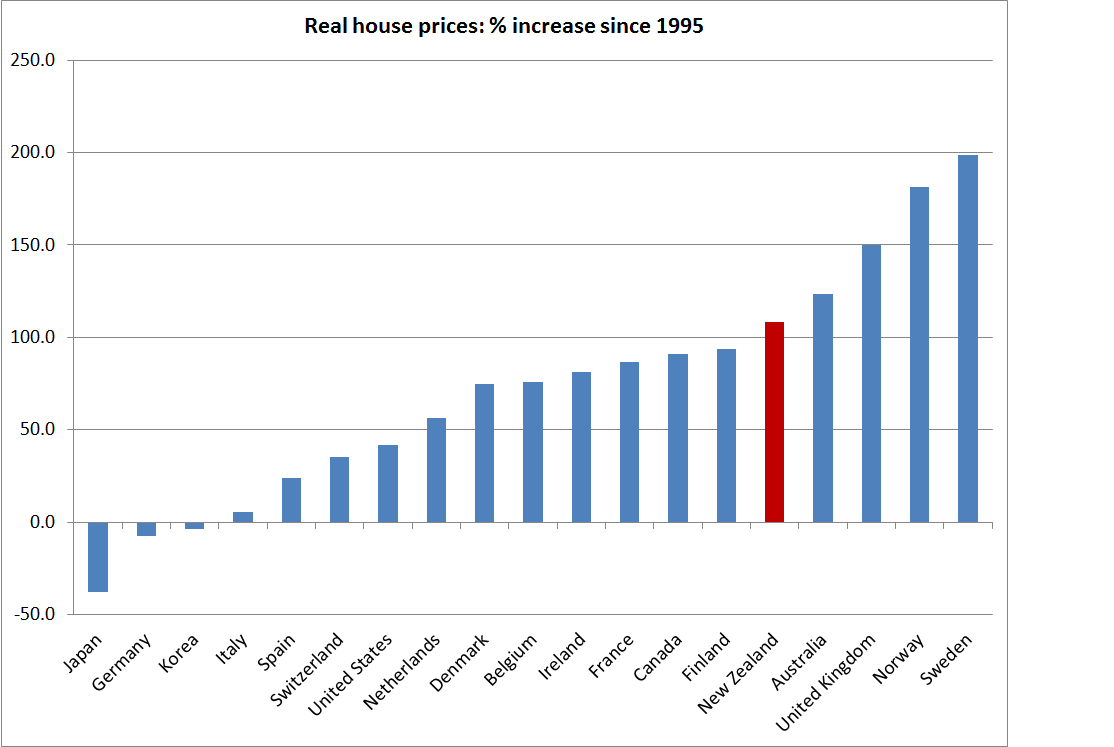
Even over the whole 20 years, New Zealand real house prices have increased less than those in Australia and the UK. For the boom period itself (1995 to 2007) New Zealand’s house price inflation was only a touch stronger than that of the median country in this sample.
For most of the countries the BIS has data back to 1970, but for all 19 countries they have data back to 1976. Whether one starts from 1970 or 1976, New Zealand has had less real house price inflation than Australia and the UK, although more than Canada.

And what about periods of falling real house prices? There have been 53 episodes across these 19 countries of real house price falls in excess of 5 per cent. Germany and Belgium have had only one such episode each. Five countries – including New Zealand – have had four such episodes each (including the 15 per cent real fall in and around the 2008/09 recession).
None of this is intended to convey any sort of sense of complacency about house prices in New Zealand (and especially Auckland). They are a scandal, resulting primarily from the acts (of omission and commission) of central and local government), but if anything have increased a little less than we’ve seen in countries with similar planning and land use restrictions (the UK’s are probably tighter, but population growth pressures are less there than in New Zealand and Australia).
But singling out the New Zealand banking system – as S&P appears to have done – seems unwarranted. There is no obvious material differentiation in the sorts of housing risks being taken on by New Zealand banks. Perhaps S&P are right about New Zealand. But the Reserve Bank’s stress tests results don’t suggest so. And, perhaps as importantly, historically, vanilla housing loans don’t lead to bank collapses, and systemic banks don’t collapse (or even come under severe stress) when credit has been growing no faster than GDP. Reckless property development lending is a much more plausible culprit – and we haven’t had it in the years since the recession.
Not entirely unrelatedly, I saw a piece the other day by Auckland City’s chief economist in which he cited some work done for the Council by NZIER suggesting that part of the growth in Auckland house prices can be explained by the proposed district plan changes that will allow for greater intensification in some parts of Auckland. I’ve seen a similar argument made by the Westpac economics team. But I must be missing the point. I can easily see why allowing more intensification on a particular section will increase the relative price of that section, but I cannot see how it can be raising prices of houses and land across Auckland as a whole. Reducing land use restrictions – whether in respect of intensification, or allowing more dispersed development – increases the effective supply of land. And it seems unlikely that increasing supply will itself materially alter demand (eg materially increasing population growth, most of which is now driven by immigration policy). At least when I did introductory economics, increased supply would generally lower the price. It is easy to see why the relative (and perhaps even absolute) prices of some sections might rise if the reforms are for real, but surely any such effect should be more than offset by a fall in urban prices more generally? If there is serious scope for more intensification, and that potential is expected to be utilised, then rational potential buyers all over Auckland should already expect less intense competition in future for this now less-scarce resource. If anything, those prospective regulatory changes should be lowering prices now (perhaps only a little, because no one knows yet what real effect they will have), not raising them.
The same Chief Economist also noted that
“we need to economise on the massive amount of urban land we already have, and use it to its best effect. Acukland needs to treat its land like gold dust and a little needs to go a long way”.
I’ve got no problem with removing land use restrictions, whether they are on outward or upward development, but lets recall that the only thing that makes Auckland urban land remotely comparable to gold dust is the regulatory regime which the Auckland Council administers and imposes. Yes, Parnell might always be expensive, but there is simply no reason why sections in middling suburbs should be. Historically, as cities become richer they have less dense, not more dense. Planners, councillors, and associated bureaucracts are the people who systematically impede that normal and natural process.

With regard to the re-zoning/intensification not increasing prices you would be correct: new supply balances out the increase in the re-zoned properties values. But this only occurs over the very long term. Apart from the SHA’s none of the increased value can even begin to increase supply until the Unitary Plan is finalised and then a development completed. Best case scenario the new supply may start to arrive in bulk in about 3 years time. Some examples: I am currently negotiating to purchase a adjoining section in the Glen Eden Terrace Housing and Apartment zone. I will have to pay a premium to get it, and then sit on it for 10 years if I want to subdivide without being classed as a developer for tax purposes. I have another property purchased 17 years ago and was sub-dividable then, but which is only now economic to actually do some development.
LikeLike
It would still be a taxable activity when you do develop the site. It is only not taxable if you develop it now and tenant it for the next 10 years.
LikeLike
Thanks Mike. That slightly depressing perspective reinforces my sense that proposed reforms aren’t having much systematic effect on prices either way.
LikeLike
I have a property zoned for apartments and terrace housing under the Unitary Plan. In fact this property is also under Special Housing Area under the Housing Accord which means the rezoning starts now. The problem is that I do not have the 20 metre road frontage required under Special Housing Areas and my neighbour wants $1million plus for a 697sqm section in Otahuhu. So cant do much under Special Housing.
Recent changes voted in by Council that would drop the 20 metre road frontage would allow me to build when the Unitary plan is approved.
LikeLike
57 sacred mounts with extensive wide coverage viewshafts prevent buildings exceeding 8 to 10 metre height limits surrounding each and every sacred mount eg Mt Eden, Mt Roskill, Mt Albert, Mt Smart, Mt Wellington, One tree hill, etc
LikeLike
Have you seen this piece by Mathew Klein:
http://www.bloomberg.com/dataview/2014-02-25/bubble-to-bust-to-recovery.html
It just seems to me to ram home the point that Auckland is not in a bubble frenzy.
And if one takes a long term view, and doesn’t spend the illusory equity, there is not much to fear.
LikeLike
Pre 1944 demolition controls also means that the heritage chaps will want to leave my old run down shack intact. Now how do I build a 4 level building when the site coverage is 40% and the old shack already takes up 16% of the site?
LikeLike